You are not logged in.
This means you
CAN ONLY VIEW reports that were published prior to Monday, February 19, 2024.
You
MUST UPGRADE YOUR MEMBERSHIP if you want to see any current reports.
AFTER MARKET UPDATE - WEDNESDAY, APRIL 29TH, 2020
Previous After Market Report Next After Market Report >>>
|
|
|
|
DOW |
+532.31 |
24,633.86 |
+2.21% |
|
Volume |
1,219,394,135 |
+18% |
|
Volume |
4,333,625,900 |
+18% |
|
NASDAQ |
+306.98 |
8,914.71 |
+3.57% |
|
Advancers |
2,562 |
88% |
|
Advancers |
2,643 |
82% |
|
S&P 500 |
+76.12 |
2,939.51 |
+2.66% |
|
Decliners |
350 |
12% |
|
Decliners |
595 |
18% |
|
Russell 2000 |
+62.68 |
1,360.76 |
+4.83% |
|
52 Wk Highs |
24 |
|
|
52 Wk Highs |
41 |
|
|
S&P 600 |
+41.88 |
802.96 |
+5.50% |
|
52 Wk Lows |
4 |
|
|
52 Wk Lows |
5 |
|
|
 |
Breadth Positive and Volume Higher Behind Indices' Additional Gains
Kenneth J. Gruneisen - Passed the CAN SLIM® Master's Exam
The Dow advanced 532 points, while the S&P 500 gained 2.7% and is on pace for its best monthly performance since 1974. The Nasdaq Composite jumped 3.6%. Breadth was clearly positive as advancers led decliners by more than a 7-1 margin on the NYSE and 4-1 on the Nasdaq exchange. The reported volume totals were higher than the prior session on the NYSE and on the Nasdaq exchange, indicative of greater institutional buying demand. There were 20 high-ranked companies from the Leaders List hit new 52-week highs and were listed on the BreakOuts Page, matching the 20 on the prior session. New 52-week highs totals contracted yet still outnumbered the new 52-week lows totals on the NYSE and on the Nasdaq exchange. The major indices are in a confirmed uptrend (M criteria). Any sustainable rally requires a healthy crop of new leaders, so it is important to see continued improvement in this area. Charts used courtesy of www.stockcharts.com
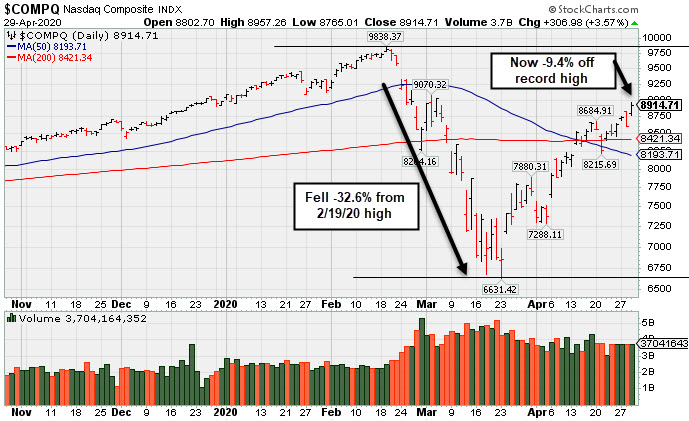
PICTURED: The Nasdaq Composite Index slumped -32.6% from its 2/19/20 record high and has rebounded above its 50-day and 200-day moving average (DMA) lines to now sit only -9.4% off its high.
Stocks finished higher Wednesday following a busy day of central bank updates, corporate earnings reports, and positive developments on a potential COVID-19 treatment. Gilead Sciences (GILD +5.68%) rose after its experimental coronavirus drug reportedly demonstrated positive effects in a recent study.
In central bank news, the Federal Reserve pledged to keep the Fed-funds rate at the near zero range until full employment and inflation return. Furthermore, Fed Chair Jerome Powell noted the economy would need the Fed’s continued support for a “robust” recovery. On the data front, an advanced reading of first-quarter GDP showed the economy shrank by 4.8% during the first three months of the year, the largest contraction since 2008. Treasuries fluctuated, with the yield on the benchmark 10-year note holding steady at 0.61%.
Nine of 11 sectors finished the session in positive territory, with Consumer Staples and Utilities bucking the uptrend. Shares of Energy companies paced gains, as WTI crude rebounded 24.8% to $15.40/barrel after U.S. crude stockpiles rose by less than expected last week. In earnings, Google parent Alphabet (GOOGL +8.89%) and provided a tailwind to Tech and internet-related stocks, as the company easily topped analyst earnings and revenue expectations. Meanwhile, Boeing (BA +5.96%) rose despite reporting its second-straight quarterly loss. MasterCard (MA +7.21%) rose after beating profit and sales estimates, while also citing “early signs of spending levels stabilizing.” Elsewhere, Starbucks (SBUX -2.33%) after reporting a 10% decline in same-store sales last quarter. |
 Kenneth J. Gruneisen started out as a licensed stockbroker in August 1987, a couple of months prior to the historic stock market crash that took the Dow Jones Industrial Average down -22.6% in a single day. He has published daily fact-based fundamental and technical analysis on high-ranked stocks online for two decades. Through FACTBASEDINVESTING.COM, Kenneth provides educational articles, news, market commentary, and other information regarding proven investment systems that work in good times and bad.
Comments contained in the body of this report are technical opinions only and are not necessarily those of Gruneisen Growth Corp. The material herein has been obtained from sources believed to be reliable and accurate, however, its accuracy and completeness cannot be guaranteed. Our firm, employees, and customers may effect transactions, including transactions contrary to any recommendation herein, or have positions in the securities mentioned herein or options with respect thereto. Any recommendation contained in this report may not be suitable for all investors and it is not to be deemed an offer or solicitation on our part with respect to the purchase or sale of any securities. |
|
 |
Energy, Financials, and Semiconductor Index Led Gainers
Kenneth J. Gruneisen - Passed the CAN SLIM® Master's Exam
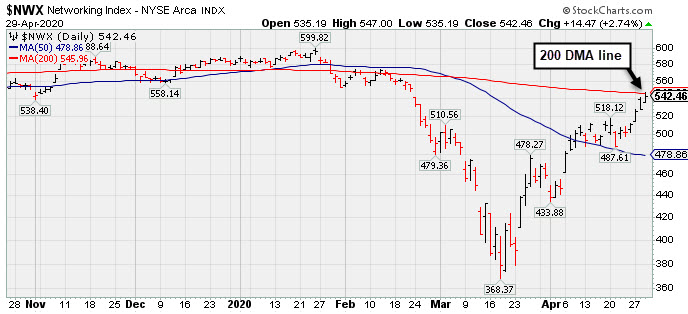
Financials had a positive bias as the Bank Index ($BKX +4.33%) and the Broker/Dealer Index ($XBD +4.05%) both posted solid gains. The Retail Index ($RLX +2.39%) also rose. The Semiconductor Index ($SOX +4.94%) led the tech sector and the Networking Index ($NWX +2.74%) posted a solid gain, but the Biotech Index ($BTK -0.11%) ended slightly in the red. The Oil Services Index ($OSX +9.35%) and the Integrated Oil Index ($XOI +8.84%) both posted standout gains. PICTURED: The Networking Index ($NWX +2.74%) has rebounded near its 200-day moving average (DMA) line.
| Oil Services |
$OSX |
31.87 |
+2.73 |
+9.37% |
-59.29% |
| Integrated Oil |
$XOI |
805.09 |
+65.37 |
+8.84% |
-36.63% |
| Semiconductor |
$SOX |
1,797.76 |
+84.55 |
+4.94% |
-2.80% |
| Networking |
$NWX |
542.46 |
+14.47 |
+2.74% |
-7.02% |
| Broker/Dealer |
$XBD |
248.11 |
+9.65 |
+4.05% |
-14.56% |
| Retail |
$RLX |
2,637.16 |
+61.49 |
+2.39% |
+7.67% |
| Gold & Silver |
$XAU |
119.47 |
+1.89 |
+1.61% |
+11.74% |
| Bank |
$BKX |
77.28 |
+3.21 |
+4.33% |
-31.83% |
| Biotech |
$BTK |
5,253.50 |
-6.03 |
-0.11% |
+3.67% |
|
|
|
 |
Featured Stocks
Kenneth J. Gruneisen - Passed the CAN SLIM® Master's Exam
As leadership improves the number of stocks covered in this area should be expected to increase gradually, as superior candidates are added to the Featured Stocks list on a case-by-case basis. Feel free to contact us if you have a need for any additional information. |
|
|
Color Codes Explained :
Y - Better candidates highlighted by our
staff of experts.
G - Previously featured
in past reports as yellow but may no longer be buyable under the
guidelines.
***Last / Change / Volume data in this table is the closing quote data***
Symbol/Exchange
Company Name
Industry Group |
PRICE |
CHANGE
(%Change) |
Day High |
Volume
(% DAV)
(% 50 day avg vol) |
52 Wk Hi
% From Hi |
Featured
Date |
Price
Featured |
Pivot Featured |
|
Max Buy |
 EBS
-
NYSE
EBS
-
NYSE
Emergent Biosolutions
DRUGS - Biotechnology
|
$73.95
|
-1.46
-1.94% |
$77.82
|
705,280
121.60% of 50 DAV
50 DAV is 580,000
|
$83.01
-10.91%
|
4/24/2020
|
$72.10
|
PP = $73.99
|
|
MB = $77.69
|
 Most Recent Note - 4/29/2020 5:03:53 PM
Y - Due to report Mar '20 earnings news after the close on Thursday, 4/30/20. Volume and volatility often increase near earnings news. Color code was changed to yellow after pulling back following 2 big volume-driven gains for a new all-time high. Highlighted with pivot point cited based on its December 2018 high in the 4/24/20 mid-day report. See the latest FSU analysis for more details and an annotated graph.
>>> FEATURED STOCK ARTICLE : Volume-Driven Gain for Vaccine Maker With Great Earnings History - 4/24/2020 |
View all notes |
Set NEW NOTE alert |
Company Profile |
SEC
News |
Chart |
Request a new note
C
A
S
I |
NFLX
-
NASDAQ
Netflix Inc
SPECIALTY RETAIL - Music and Video Stores
|
$411.89
|
+8.06
2.00% |
$415.86
|
9,616,336
101.86% of 50 DAV
50 DAV is 9,441,000
|
$449.52
-8.37%
|
4/13/2020
|
$393.60
|
PP = $393.62
|
|
MB = $413.30
|
Most Recent Note - 4/29/2020 5:05:56 PM
Y - Managed a "positive reversal" today after pulling back to test prior highs in the $393 area defining initial support to watch. Fundamentals remain strong after it reported earnings +107% on +28% sales revenues for the Mar '20 quarter versus the year ago period.
>>> FEATURED STOCK ARTICLE : Netflix Reported Another Strong Quarter After Rally From Base - 4/21/2020 |
View all notes |
Set NEW NOTE alert |
Company Profile |
SEC
News |
Chart |
Request a new note
C
A
S
I |
QLYS
-
NASDAQ
Qualys Inc
Computer Sftwr-Security
|
$104.84
|
+0.04
0.04% |
$106.77
|
631,834
120.35% of 50 DAV
50 DAV is 525,000
|
$110.89
-5.46%
|
4/9/2020
|
$100.44
|
PP = $97.22
|
|
MB = $102.08
|
Most Recent Note - 4/29/2020 12:48:11 PM
G - Consolidating near its all-time high, extended from the previously noted base. Prior highs in the $97 area define initial support to watch on pullbacks. Due to report earnings news on 5/07/20. See the latest FSU analysis for more details and an annotated graph.
>>> FEATURED STOCK ARTICLE : Volume Totals Cooling While Stubbornly Holding Ground Near High - 4/27/2020 |
View all notes |
Set NEW NOTE alert |
Company Profile |
SEC
News |
Chart |
Request a new note
C
A
S
I |
|
|
|
THESE ARE NOT BUY RECOMMENDATIONS!
Comments contained in the body of this report are technical
opinions only. The material herein has been obtained
from sources believed to be reliable and accurate, however,
its accuracy and completeness cannot be guaranteed.
This site is not an investment advisor, hence it does
not endorse or recommend any securities or other investments.
Any recommendation contained in this report may not
be suitable for all investors and it is not to be deemed
an offer or solicitation on our part with respect to
the purchase or sale of any securities. All trademarks,
service marks and trade names appearing in this report
are the property of their respective owners, and are
likewise used for identification purposes only.
This report is a service available
only to active Paid Premium Members.
You may opt-out of receiving report notifications
at any time. Questions or comments may be submitted
by writing to Premium Membership Services 665 S.E. 10 Street, Suite 201 Deerfield Beach, FL 33441-5634 or by calling 1-800-965-8307
or 954-785-1121.
|
|
|