You are not logged in.
This means you
CAN ONLY VIEW reports that were published prior to Monday, February 19, 2024.
You
MUST UPGRADE YOUR MEMBERSHIP if you want to see any current reports.
AFTER MARKET UPDATE - TUESDAY, APRIL 28TH, 2020
Previous After Market Report Next After Market Report >>>
|
|
|
|
DOW |
-32.23 |
24,101.55 |
-0.13% |
|
Volume |
1,032,556,030 |
+6% |
|
Volume |
3,678,794,600 |
+0% |
|
NASDAQ |
-122.43 |
8,607.73 |
-1.40% |
|
Advancers |
2,079 |
72% |
|
Advancers |
1,893 |
59% |
|
S&P 500 |
-15.09 |
2,863.39 |
-0.52% |
|
Decliners |
814 |
28% |
|
Decliners |
1,330 |
41% |
|
Russell 2000 |
+16.20 |
1,298.08 |
+1.26% |
|
52 Wk Highs |
31 |
|
|
52 Wk Highs |
54 |
|
|
S&P 600 |
+15.24 |
761.08 |
+2.04% |
|
52 Wk Lows |
4 |
|
|
52 Wk Lows |
8 |
|
|
 |
Small Caps Outperformed Other Major Indices
Kenneth J. Gruneisen - Passed the CAN SLIM® Master's Exam
The Dow fell 32 points, snapping a four-day winning streak. The S&P 500 lost 0.5%, while the Nasdaq Composite slipped 1.4%. Small-cap stocks outperformed their large-cap peers on Wall Street, with the Russell 2000 adding 1.2%, the benchmark’s fifth consecutive daily advance. Breadth was positive as advancers led decliners by more than a 2-1 margin on the NYSE and 3-2 on the Nasdaq exchange. The reported volume totals were higher than the prior session on the NYSE and on the Nasdaq exchange. There were 20 high-ranked companies from the Leaders List hit new 52-week highs and were listed on the BreakOuts Page, versus 27 on the prior session. New 52-week highs outnumbered the new 52-week lows totals on the NYSE and on the Nasdaq exchange. The major indices are in a confirmed uptrend (M criteria). Any sustainable rally requires a healthy crop of new leaders, so it is important to see continued improvement in this area. Charts used courtesy of www.stockcharts.com
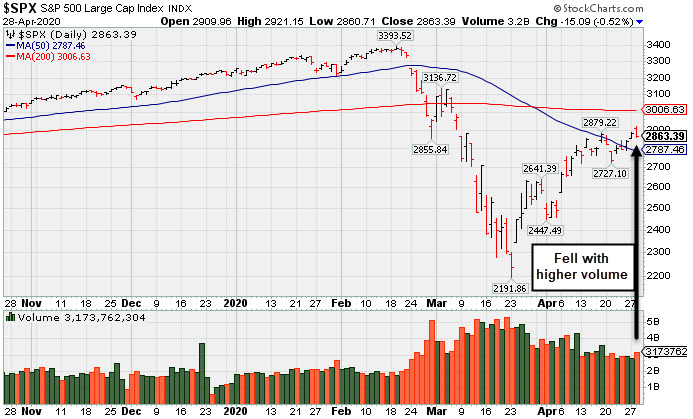
PICTURED: The S&P 500 Index pulled back with higher volume. Recently it rebounded above its 50-day moving average (DMA) line.
Stocks finished lower on Tuesday, as weakness in Tech-related stocks reversed an early session rally. Still, investor sentiment seemingly remained elevated amid optimism surrounding plans to reopen the U.S. economy.
Seven of 11 S&P 500 sectors ended in positive territory, with Energy shares leading advancers with a 2.2% gain. Healthcare lagged the most, with Merck (MRK -3.33%) down after the pharmaceutical company provided downbeat guidance. The Technology and Communications Services groups were also notable decliners, with Microsoft (MSFT -2.44%) falling. F5 Networks (FFIV +7.59%) bucked the downtrend of the Tech sector after the company revealed its most recent profit tally benefited from people working remotely. In other earnings, UBS (UBS +5.83%) rose after delivering a 40% spike in profit during the January-March period. 3M (MMM +2.58%) rose after reporting better-than-expected sales boosted by an increase in demand for personal protective equipment.
On the data front, the Conference Board’s gauge of consumer confidence fell to a six-year low in April. Separately, an update showed wholesale inventories slumped 1% in March, which was worse than the 0.4% anticipated drop. Treasuries strengthened, with the yield on the 10-year note down five basis points to 0.61%. In commodities, WTI crude pared a 20% slump in earlier trading, but still fell 1.1% to $12.63/barrel. |
 Kenneth J. Gruneisen started out as a licensed stockbroker in August 1987, a couple of months prior to the historic stock market crash that took the Dow Jones Industrial Average down -22.6% in a single day. He has published daily fact-based fundamental and technical analysis on high-ranked stocks online for two decades. Through FACTBASEDINVESTING.COM, Kenneth provides educational articles, news, market commentary, and other information regarding proven investment systems that work in good times and bad.
Comments contained in the body of this report are technical opinions only and are not necessarily those of Gruneisen Growth Corp. The material herein has been obtained from sources believed to be reliable and accurate, however, its accuracy and completeness cannot be guaranteed. Our firm, employees, and customers may effect transactions, including transactions contrary to any recommendation herein, or have positions in the securities mentioned herein or options with respect thereto. Any recommendation contained in this report may not be suitable for all investors and it is not to be deemed an offer or solicitation on our part with respect to the purchase or sale of any securities. |
|
 |
Financial, Energy, and Networking Indexes Rose
Kenneth J. Gruneisen - Passed the CAN SLIM® Master's Exam
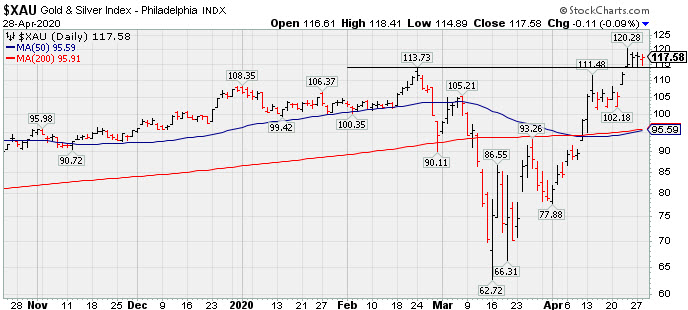
Financials had a positive bias as the Bank Index ($BKX +1.57%) and the Broker/Dealer Index ($XBD +1.24%) both posted solid gains. The Retail Index ($RLX -1.01%) fell. The Biotech Index ($BTK -2.60%) outpaced the Semiconductor Index ($SOX -0.69%) to the downside while the Networking Index ($NWX +0.52%) posted a small gain. The Oil Services Index ($OSX +4.46%) and the Integrated Oil Index ($XOI +2.82%) both posted solid gains. PICTURED: The Gold & Silver Index ($XAU -0.09%) was little changed, hovering near its 52-week high.
| Oil Services |
$OSX |
29.14 |
+1.24 |
+4.44% |
-62.78% |
| Integrated Oil |
$XOI |
739.72 |
+20.28 |
+2.82% |
-41.78% |
| Semiconductor |
$SOX |
1,713.21 |
-11.83 |
-0.69% |
-7.38% |
| Networking |
$NWX |
527.98 |
+2.71 |
+0.52% |
-9.50% |
| Broker/Dealer |
$XBD |
238.46 |
+2.92 |
+1.24% |
-17.88% |
| Retail |
$RLX |
2,575.67 |
-26.40 |
-1.01% |
+5.16% |
| Gold & Silver |
$XAU |
117.58 |
-0.11 |
-0.09% |
+9.97% |
| Bank |
$BKX |
74.07 |
+1.14 |
+1.56% |
-34.66% |
| Biotech |
$BTK |
5,259.53 |
-140.22 |
-2.60% |
+3.79% |
|
|
|
 |
Featured Stocks
Kenneth J. Gruneisen - Passed the CAN SLIM® Master's Exam
As leadership improves the number of stocks covered in this area should be expected to increase gradually, as superior candidates are added to the Featured Stocks list on a case-by-case basis. Feel free to contact us if you have a need for any additional information. |
|
|
Color Codes Explained :
Y - Better candidates highlighted by our
staff of experts.
G - Previously featured
in past reports as yellow but may no longer be buyable under the
guidelines.
***Last / Change / Volume data in this table is the closing quote data***
|
|
|
THESE ARE NOT BUY RECOMMENDATIONS!
Comments contained in the body of this report are technical
opinions only. The material herein has been obtained
from sources believed to be reliable and accurate, however,
its accuracy and completeness cannot be guaranteed.
This site is not an investment advisor, hence it does
not endorse or recommend any securities or other investments.
Any recommendation contained in this report may not
be suitable for all investors and it is not to be deemed
an offer or solicitation on our part with respect to
the purchase or sale of any securities. All trademarks,
service marks and trade names appearing in this report
are the property of their respective owners, and are
likewise used for identification purposes only.
This report is a service available
only to active Paid Premium Members.
You may opt-out of receiving report notifications
at any time. Questions or comments may be submitted
by writing to Premium Membership Services 665 S.E. 10 Street, Suite 201 Deerfield Beach, FL 33441-5634 or by calling 1-800-965-8307
or 954-785-1121.
|
|
|