You are not logged in.
This means you
CAN ONLY VIEW reports that were published prior to Monday, February 19, 2024.
You
MUST UPGRADE YOUR MEMBERSHIP if you want to see any current reports.
AFTER MARKET UPDATE - MONDAY, APRIL 27TH, 2020
Previous After Market Report Next After Market Report >>>
|
|
|
|
DOW |
+358.51 |
24,133.78 |
+1.51% |
|
Volume |
969,586,484 |
-8% |
|
Volume |
3,662,188,000 |
+1% |
|
NASDAQ |
+95.64 |
8,730.16 |
+1.11% |
|
Advancers |
2,288 |
78% |
|
Advancers |
2,565 |
78% |
|
S&P 500 |
+41.74 |
2,878.48 |
+1.47% |
|
Decliners |
638 |
22% |
|
Decliners |
704 |
22% |
|
Russell 2000 |
+48.82 |
1,281.88 |
+3.96% |
|
52 Wk Highs |
31 |
|
|
52 Wk Highs |
67 |
|
|
S&P 600 |
+30.70 |
745.84 |
+4.29% |
|
52 Wk Lows |
9 |
|
|
52 Wk Lows |
12 |
|
|
 |
Leadership Improved as Major Indices Rose With Greater Volume
Kenneth J. Gruneisen - Passed the CAN SLIM® Master's Exam
The Dow climbed 358 points to close above the 24,000 level. The S&P 500 advanced 1.5%, on course for its best month since 1987, while the Nasdaq Composite was up 1.1%. Breadth was positive as advancers led decliners by more than a 3-1 margin on the NYSE and on the Nasdaq exchange. The reported volume totals were mixed, lower than the prior session on the NYSE and slightly higher on the Nasdaq exchange. There were 26 high-ranked companies from the Leaders List hit new 52-week highs and were listed on the BreakOuts Page, versus 17 on the prior session. New 52-week highs outnumbered the new 52-week lows totals on the NYSE and on the Nasdaq exchange. The major indices are in a confirmed uptrend (M criteria). Any sustainable rally requires a healthy crop of new leaders, so it is important to see continued improvement in this area. Charts used courtesy of www.stockcharts.com
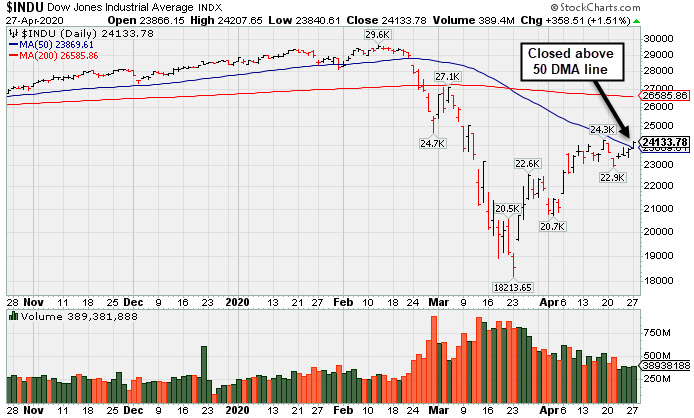
PICTURED: The Dow Jones Industrial Average rebounded above its 50-day moving average (DMA) line.
Stocks finished higher on Monday as more economies around the world made plans to resume activity and ease COVID-19-related lockdowns. Some U.S. states have reopened certain businesses, while New York’s governor outlined plans for a phased reopening starting in mid-May. Italy and Spain were among the European countries that established timetables to lift restrictions in the coming weeks.
U.S. Treasuries weakened, with the yield on the 10-year note up seven basis points to 0.66%. Overseas, further monetary stimulus from the Bank of Japan also helped lift sentiment, with policymakers pledging to purchase as much government debt as necessary to support its economy.
All 11 S&P 500 sectors closed in positive territory with Financials pacing gains, up 3.6%. Deutsche Bank (DB +12.44%) helped provide a tailwind for the group, with the German bank jumping after announcing it would exceed consensus forecasts and deliver a profit for its latest quarter. In other corporate news, Tesla (TSLA +10.15%) rose after announcing some workers would return to its California factory next week. Elsewhere, clothing retailers and apparel manufacturers outperformed, with Kohl’s (KSS +17.72%) and PVH Corp. (PVH +15.18%) both rallying.
On the data front, an update from the Dallas Fed showed manufacturing activity in the region plunged to a record low in April, though the reading was still better-than-expected. In commodities, WTI crude fell another 22.6% to $13.12/barrel on the heels of its worst week on record. |
 Kenneth J. Gruneisen started out as a licensed stockbroker in August 1987, a couple of months prior to the historic stock market crash that took the Dow Jones Industrial Average down -22.6% in a single day. He has published daily fact-based fundamental and technical analysis on high-ranked stocks online for two decades. Through FACTBASEDINVESTING.COM, Kenneth provides educational articles, news, market commentary, and other information regarding proven investment systems that work in good times and bad.
Comments contained in the body of this report are technical opinions only and are not necessarily those of Gruneisen Growth Corp. The material herein has been obtained from sources believed to be reliable and accurate, however, its accuracy and completeness cannot be guaranteed. Our firm, employees, and customers may effect transactions, including transactions contrary to any recommendation herein, or have positions in the securities mentioned herein or options with respect thereto. Any recommendation contained in this report may not be suitable for all investors and it is not to be deemed an offer or solicitation on our part with respect to the purchase or sale of any securities. |
|
 |
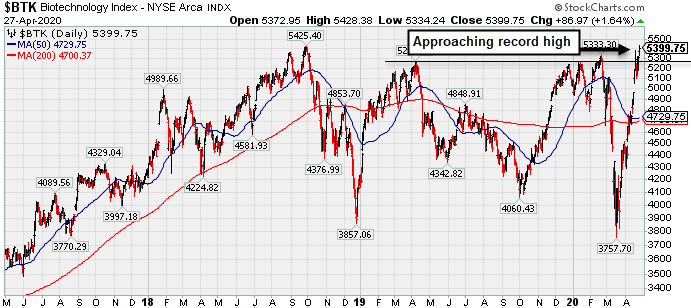
Financial, Tech, and Integrated Oil Index Posted Best Gains
Kenneth J. Gruneisen - Passed the CAN SLIM® Master's Exam
Financials had a positive bias as the Bank Index ($BKX +5.64%) and the Broker/Dealer Index ($XBD +4.79%) both posted solid gains. The Retail Index ($RLX +0.44%) edged higher. The tech sector had a positive bias as the Semiconductor Index ($SOX +1.32%), Networking Index ($NWX +2.75%), and the Biotech Index ($BTK +1.64%) each posted gains. The Gold & Silver Index ($XAU +0.11%) was little changed while the Oil Services Index ($OSX +0.49%) edged higher and the Integrated Oil Index ($XOI +2.75%) posted a solid gain. PICTURED: The Biotech Index ($BTK +1.64%) hit a new 52-week high and it is approaching its record high from September 2018.
| Oil Services |
$OSX |
28.26 |
+0.14 |
+0.50% |
-63.90% |
| Integrated Oil |
$XOI |
719.44 |
+19.28 |
+2.75% |
-43.38% |
| Semiconductor |
$SOX |
1,725.04 |
+22.48 |
+1.32% |
-6.74% |
| Networking |
$NWX |
525.28 |
+14.07 |
+2.75% |
-9.96% |
| Broker/Dealer |
$XBD |
235.54 |
+10.77 |
+4.79% |
-18.89% |
| Retail |
$RLX |
2,602.07 |
+11.47 |
+0.44% |
+6.24% |
| Gold & Silver |
$XAU |
117.69 |
+0.14 |
+0.12% |
+10.07% |
| Bank |
$BKX |
72.93 |
+3.90 |
+5.65% |
-35.67% |
| Biotech |
$BTK |
5,399.75 |
+86.97 |
+1.64% |
+6.56% |
|
|
|
 |
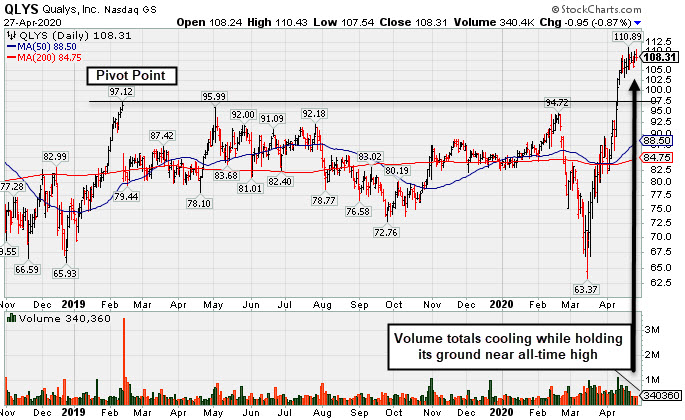
Volume Totals Cooling While Stubbornly Holding Ground Near High
Kenneth J. Gruneisen - Passed the CAN SLIM® Master's Exam
Qualys Inc (QLYS -$0.95 or -0.87% to $108.31) has seen recent volume totals cooling while stubbornly holding its ground near its all-time high. It is very extended from the previously noted base. Prior highs in the $97 area define initial support to watch on pullbacks.
QLYS has traded up as much as +10.4% since highlighted in yellow with new pivot point cited based on its 2/12/19 high plus 10 cents in the 4/09/20 mid-day report (read here). It powered to a new all-time highs with big volume-driven gains. It was noted, "The volume-driven gains above the pivot point for a new high (N criteria) may be an indication of fresh institutional buying demand that can lead to a meaningful and sustained advance in price."
Keep in mind it is due to report Mar '20 quarterly earnings news on 5/07/20. Volume and volatility often increase near earnings news. For the Dec '19 quarter its earnings rose +25% on +14% sales revenues, its 11th consecutive quarter above the +25% minimum earnings guideline (C criteria). Its annual earnings history (A criteria) has also been strong. The Computer Software - Security group has a 91 Group Relative Strength Rating, and leadership (L criteria) in the industry group is another favorable factor with respect to the fact-based investment system.
Currently it has a Timeliness Rating of A and Sponsorship Rating of E. Its Accumulation/Distribution rating is A while its Up/Down Volume Ratio of 1.4 is an unbiased indication its shares have been under accumulation over the past 50 days. The number of top-rated funds owning its shares rose from 294 in Jun '17 to 481 in Mar '20, a reassuring sign concerning the I criteria. Its small supply of only 32.4 million shares (S criteria) in the public float can contribute to greater volatility in the event of institutional buying or selling.
|
|
|
Color Codes Explained :
Y - Better candidates highlighted by our
staff of experts.
G - Previously featured
in past reports as yellow but may no longer be buyable under the
guidelines.
***Last / Change / Volume data in this table is the closing quote data***
Symbol/Exchange
Company Name
Industry Group |
PRICE |
CHANGE
(%Change) |
Day High |
Volume
(% DAV)
(% 50 day avg vol) |
52 Wk Hi
% From Hi |
Featured
Date |
Price
Featured |
Pivot Featured |
|
Max Buy |
 EBS
-
NYSE
EBS
-
NYSE
Emergent Biosolutions
DRUGS - Biotechnology
|
$78.58
|
+5.28
7.20% |
$83.01
|
1,375,032
250.01% of 50 DAV
50 DAV is 550,000
|
$74.00
6.19%
|
4/24/2020
|
$72.10
|
PP = $73.99
|
|
MB = $77.69
|
 Most Recent Note - 4/27/2020 5:24:56 PM
G - Color code is changed to green after today's "breakaway gap" and big volume-driven gain clinched a technical buy signal and it closed above the "max buy" level. Highlighted with pivot point cited based on its December 2018 high in the 4/24/20 mid-day report. Due to report Mar '20 earnings news on 4/30/20. Volume and volatility often increase near earnings news. See the latest FSU analysis for more details and an annotated graph.
>>> FEATURED STOCK ARTICLE : Volume-Driven Gain for Vaccine Maker With Great Earnings History - 4/24/2020 |
View all notes |
Set NEW NOTE alert |
Company Profile |
SEC
News |
Chart |
Request a new note
C
A
S
I |
NFLX
-
NASDAQ
Netflix Inc
SPECIALTY RETAIL - Music and Video Stores
|
$421.38
|
-3.61
-0.85% |
$429.00
|
6,255,220
67.42% of 50 DAV
50 DAV is 9,278,000
|
$449.52
-6.26%
|
4/13/2020
|
$393.60
|
PP = $393.62
|
|
MB = $413.30
|
Most Recent Note - 4/27/2020 5:25:48 PM
G - Volume was lighter behind today's small loss while still hovering near its all-time high, extended from the previously noted base. Reported earnings +107% on +28% sales revenues for the Mar '20 quarter versus the year ago period. Disciplined investors avoid chasing stocks more than +5% above the prior high or pivot point.
>>> FEATURED STOCK ARTICLE : Netflix Reported Another Strong Quarter After Rally From Base - 4/21/2020 |
View all notes |
Set NEW NOTE alert |
Company Profile |
SEC
News |
Chart |
Request a new note
C
A
S
I |
QLYS
-
NASDAQ
Qualys Inc
Computer Sftwr-Security
|
$108.31
|
-0.95
-0.87% |
$110.43
|
340,360
64.22% of 50 DAV
50 DAV is 530,000
|
$110.89
-2.33%
|
4/9/2020
|
$100.44
|
PP = $97.22
|
|
MB = $102.08
|
Most Recent Note - 4/27/2020 5:27:41 PM
G - Volume totals have been cooling while stubbornly holding its ground near its all-time high, very extended from the previously noted base. Prior highs in the $97 area define initial support to watch on pullbacks. Due to report earnings news on 5/07/20. See the latest FSU analysis for more details and a new annotated graph.
>>> FEATURED STOCK ARTICLE : Volume Totals Cooling While Stubbornly Holding Ground Near High - 4/27/2020 |
View all notes |
Set NEW NOTE alert |
Company Profile |
SEC
News |
Chart |
Request a new note
C
A
S
I |
|
|
|
THESE ARE NOT BUY RECOMMENDATIONS!
Comments contained in the body of this report are technical
opinions only. The material herein has been obtained
from sources believed to be reliable and accurate, however,
its accuracy and completeness cannot be guaranteed.
This site is not an investment advisor, hence it does
not endorse or recommend any securities or other investments.
Any recommendation contained in this report may not
be suitable for all investors and it is not to be deemed
an offer or solicitation on our part with respect to
the purchase or sale of any securities. All trademarks,
service marks and trade names appearing in this report
are the property of their respective owners, and are
likewise used for identification purposes only.
This report is a service available
only to active Paid Premium Members.
You may opt-out of receiving report notifications
at any time. Questions or comments may be submitted
by writing to Premium Membership Services 665 S.E. 10 Street, Suite 201 Deerfield Beach, FL 33441-5634 or by calling 1-800-965-8307
or 954-785-1121.
|
|
|