You are not logged in.
This means you
CAN ONLY VIEW reports that were published prior to Monday, February 19, 2024.
You
MUST UPGRADE YOUR MEMBERSHIP if you want to see any current reports.
AFTER MARKET UPDATE - TUESDAY, APRIL 26TH, 2022
Previous After Market Report Next After Market Report >>>
|
|
|
|
DOW |
-809.28 |
33,240.18 |
-2.38% |
|
Volume |
1,000,823,413 |
-9% |
|
Volume |
5,045,768,400 |
+6% |
|
NASDAQ |
-514.11 |
12,490.74 |
-3.95% |
|
Advancers |
532 |
17% |
|
Advancers |
867 |
21% |
|
S&P 500 |
-120.92 |
4,175.20 |
-2.81% |
|
Decliners |
2,675 |
83% |
|
Decliners |
3,245 |
79% |
|
Russell 2000 |
-63.73 |
1,890.47 |
-3.26% |
|
52 Wk Highs |
9 |
|
|
52 Wk Highs |
38 |
|
|
S&P 600 |
-38.00 |
1,226.45 |
-3.01% |
|
52 Wk Lows |
392 |
|
|
52 Wk Lows |
783 |
|
|
Damaging losses last week signaled a market correction (M criteria). Limiting losses and reducing market exposure is prudent until a new confirmed rally is noted.
|
 |
Major Indices Fall Decisively as Market Correction Worsens
Kenneth J. Gruneisen - Passed the CAN SLIM® Master's Exam
The Nasdaq Composite slumped nearly 4% for its worst day since September 2020. The tech-heavy index fell back into bear market territory (defined as a 20% drawdown from a recent peak). The Dow dropped 809 points, while the S&P 500 lost 2.8%. Volume totals reported were mixed, lighter than the prior session on the NYSE and higher on the Nasdaq exchange. Decliners led advancers by a 5-1 margin on the NYSE and by nearly 4-1 on the Nasdaq exchange. There was 1 high-ranked company from the Leaders List that hit a new 52-week high and was listed on the BreakOuts Page, versus zero on the prior session. New 52-week lows solidly outnumbered new 52-week highs on both the NYSE and the Nasdaq exchange. The damage to the major indices last week signaled a market correction (M criteria). Strict followers of the fact-based investment system know to use great caution and always be prepared to reduce exposure by selling any weakening stocks on a case-by-case basis.
Chart courtesy of www.stockcharts.com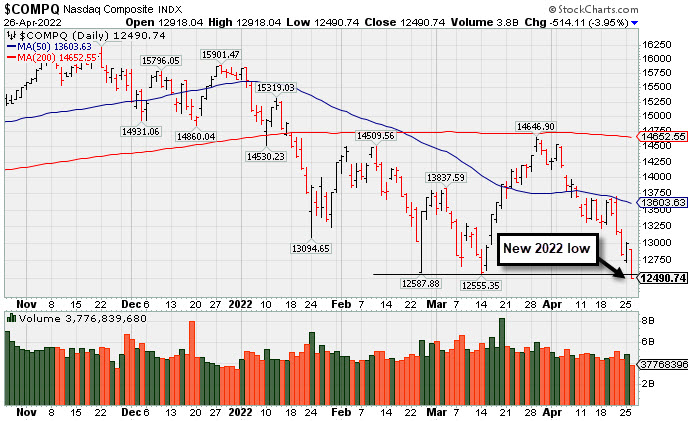 PICTURED: The Nasdaq Composite Index abruptly slumped to a new 2022 low.
U.S. stocks sold off on Tuesday as a rout in growth-related shares deepened ahead of profit tallies from key mega-cap companies. Investors remained cautious as looming central bank rate hikes and renewed concerns around COVID-19 lockdowns in China lingered as market overhangs.
Perceived safe haven assets caught a bid. A gauge of the U.S. dollar climbed 0.6% to a fresh two-year high, while the yield on the 10-year note slid eight basis points (0.08%) to 2.74%. Meanwhile, the two-year note yield shed 12 basis points (0.12%) to 2.50% following robust demand for a $48 billion auction of the maturity. On the data front, the Conference Board’s measure of consumer confidence unexpectedly eased in April. Separately, new home sales slumped a larger-than-anticipated 8.6% in March, while two gauges of home prices saw record monthly upticks.
Ten of 11 S&P 500 sectors closed in negative territory. Consumer Discretionary lagged, pressured by a slump in Tesla Inc. (TSLA -12.18%) amid concerns that CEO Elon Musk would sell shares to fund his takeover of Twitter Inc. (TWTR -3.91%) The Energy group provided a bright spot, with Valero Energy Corp. (VLO +4.22%) up after reporting its best margins since 2015. In other earnings, United Parcel Service Inc. (UPS -3.48%) fell as fading pandemic demand offset its upbeat profit tally. General Electric Co. (GE -10.34%) fell after flagging inflation and supply chain headwinds.
|
 Kenneth J. Gruneisen started out as a licensed stockbroker in August 1987, a couple of months prior to the historic stock market crash that took the Dow Jones Industrial Average down -22.6% in a single day. He has published daily fact-based fundamental and technical analysis on high-ranked stocks online for two decades. Through FACTBASEDINVESTING.COM, Kenneth provides educational articles, news, market commentary, and other information regarding proven investment systems that work in good times and bad.
Comments contained in the body of this report are technical opinions only and are not necessarily those of Gruneisen Growth Corp. The material herein has been obtained from sources believed to be reliable and accurate, however, its accuracy and completeness cannot be guaranteed. Our firm, employees, and customers may effect transactions, including transactions contrary to any recommendation herein, or have positions in the securities mentioned herein or options with respect thereto. Any recommendation contained in this report may not be suitable for all investors and it is not to be deemed an offer or solicitation on our part with respect to the purchase or sale of any securities. |
|
 |
Retail, Financial, and Tech Indexes Led Decliners
Kenneth J. Gruneisen - Passed the CAN SLIM® Master's Exam
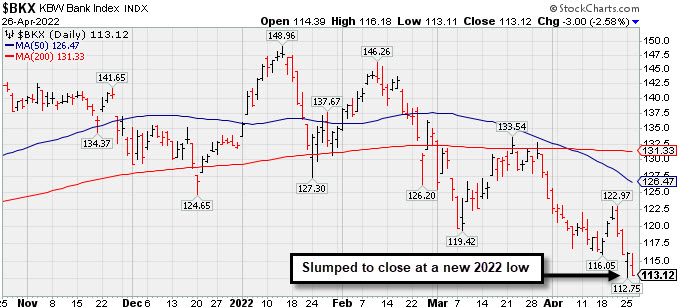
The Retail Index ($RLX -3.15%), Broker/Dealer Index ($XBD -3.37%), and Bank Index ($BKX -2.58%) each lost ground and weighed on the major averages. The tech sector had a negative bias as the Semiconductor Index ($SOX -4.38%), Biotech Index ($BTK -4.34%), and Networking Index ($NWX -3.36%) suffered unanimous losses. The Gold & Silver Index ($XAU -2.66%) outpaced the Oil Services Index ($OSX -0.56%) to the downside while the Integrated Oil Index ($XOI +0.19%) eked out a small gain. PICTURED: The Bank Index ($BKX -2.58%) slumped to close at a new 2022 low.
| Oil Services |
$OSX |
74.24 |
-0.42 |
-0.56% |
+40.83% |
| Integrated Oil |
$XOI |
1,507.74 |
+2.83 |
+0.19% |
+27.97% |
| Semiconductor |
$SOX |
2,909.12 |
-133.28 |
-4.38% |
-26.28% |
| Networking |
$NWX |
803.36 |
-27.92 |
-3.36% |
-17.27% |
| Broker/Dealer |
$XBD |
414.86 |
-14.46 |
-3.37% |
-14.79% |
| Retail |
$RLX |
3,518.83 |
-114.41 |
-3.15% |
-16.74% |
| Gold & Silver |
$XAU |
141.92 |
-3.88 |
-2.66% |
+7.15% |
| Bank |
$BKX |
113.12 |
-3.00 |
-2.58% |
-14.44% |
| Biotech |
$BTK |
4,713.63 |
-213.71 |
-4.34% |
-14.58% |
|
|
|
 |
Featured Stocks
Kenneth J. Gruneisen - Passed the CAN SLIM® Master's Exam
|
|
|
Color Codes Explained :
Y - Better candidates highlighted by our
staff of experts.
G - Previously featured
in past reports as yellow but may no longer be buyable under the
guidelines.
***Last / Change / Volume data in this table is the closing quote data***
Symbol/Exchange
Company Name
Industry Group |
PRICE |
CHANGE
(%Change) |
Day High |
Volume
(% DAV)
(% 50 day avg vol) |
52 Wk Hi
% From Hi |
Featured
Date |
Price
Featured |
Pivot Featured |
|
Max Buy |
 REGN
-
NASDAQ
REGN
-
NASDAQ
Regeneron Pharmaceutical
DRUGS - Biotechnology
|
$674.82
|
-15.51
-2.25% |
$692.51
|
537,826
81.99% of 50 DAV
50 DAV is 656,000
|
$747.42
-9.71%
|
3/14/2022
|
$647.95
|
PP = $673.96
|
|
MB = $707.66
|
 Most Recent Note - 4/26/2022 5:14:07 PM
Y - Slumped today for a loss with below average volume. Prior highs ($686 and $673) define initial support to watch above its 50 DMA line ($668).
>>> FEATURED STOCK ARTICLE : Volume Totals Have Been Light While Hovering at All-Time High - 4/4/2022 |
View all notes |
Set NEW NOTE alert |
Company Profile |
SEC
News |
Chart |
Request a new note
C
A
S
I |
IMKTA
-
NASDAQ
Ingles Markets Inc Cl A
RETAIL - Grocery Stores
|
$94.12
|
-1.38
-1.45% |
$96.14
|
129,431
113.54% of 50 DAV
50 DAV is 114,000
|
$101.98
-7.71%
|
4/11/2022
|
$96.25
|
PP = $95.75
|
|
MB = $100.54
|
Most Recent Note - 4/26/2022 5:11:29 PM
Y - Pulled back today for a 5th consecutive loss with higher volume since a "negative reversal" at its 52-week and all-time highs. Highlighted in yellow with pivot point cited based on its 3/21/22 high after a cup-with-high-handle base pattern. Subsequent gains backed by at least +40% above average volume may clinch a convincing technical buy signal. Reported Dec '21 earnings +31% on +17% sales revenues versus the year ago period. Three of the past 4 quarterly comparisons were above the +25% minimum earnings guideline (C criteria). Annual earnings growth (A criteria) has been very strong in recent years.
>>> FEATURED STOCK ARTICLE : Closed Near Session Low and Below Pivot Point Cited - 4/11/2022 |
View all notes |
Set NEW NOTE alert |
Company Profile |
SEC
News |
Chart |
Request a new note
C
A
S
I |
WCC
-
NYSE
Wesco International Inc
WHOLESALE - Electronics Wholesale
|
$120.17
|
-5.28
-4.21% |
$125.02
|
433,962
94.96% of 50 DAV
50 DAV is 457,000
|
$140.92
-14.72%
|
4/21/2022
|
$135.54
|
PP = $139.10
|
|
MB = $146.06
|
Most Recent Note - 4/26/2022 5:17:40 PM
G - Color code is changed to green after slumping below its 50 and 200 DMA lines with today's 3rd consecutive loss. Only a prompt rebound above the 50 DMA line would help its outlook improve.
>>> FEATURED STOCK ARTICLE : Approaching Prior Highs Where it Met Resistance - 4/21/2022 |
View all notes |
Set NEW NOTE alert |
Company Profile |
SEC
News |
Chart |
Request a new note
C
A
S
I |
SMPL
-
NASDAQ
Simply Good Foods Co
Food-Confectionery
|
$41.51
|
-1.64
-3.80% |
$43.14
|
479,350
72.74% of 50 DAV
50 DAV is 659,000
|
$45.77
-9.31%
|
4/13/2022
|
$41.79
|
PP = $43.27
|
|
MB = $45.43
|
Most Recent Note - 4/26/2022 5:15:41 PM
Y - Retreated further from its 52-week high with today's loss backed by below average volume. More damaging losses would raise greater concerns. Reported Feb '22 quarterly earnings +44% on +29% sales revenues versus the year ago period, its 4th strong quarterly comparison.
>>> FEATURED STOCK ARTICLE : Simply Good Foods Had a Great Breakout - 4/14/2022 |
View all notes |
Set NEW NOTE alert |
Company Profile |
SEC
News |
Chart |
Request a new note
C
A
S
I |
IMXI
-
NASDAQ
International Money Exp
Financial Svcs-Specialty
|
$19.38
|
-0.60
-3.00% |
$19.91
|
192,240
51.26% of 50 DAV
50 DAV is 375,000
|
$21.98
-11.83%
|
3/8/2022
|
$18.64
|
PP = $19.06
|
|
MB = $20.01
|
Most Recent Note - 4/26/2022 5:13:06 PM
Y - Lost ground today with below average volume. Prior highs coincide with its 50 DMA line defining important near term support to watch.
>>> FEATURED STOCK ARTICLE : Consolidating After Rally From Previously Noted Base - 4/18/2022 |
View all notes |
Set NEW NOTE alert |
Company Profile |
SEC
News |
Chart |
Request a new note
C
A
S
I |
Symbol/Exchange
Company Name
Industry Group |
PRICE |
CHANGE
(%Change) |
Day High |
Volume
(% DAV)
(% 50 day avg vol) |
52 Wk Hi
% From Hi |
Featured
Date |
Price
Featured |
Pivot Featured |
|
Max Buy |
|
|
|
THESE ARE NOT BUY RECOMMENDATIONS!
Comments contained in the body of this report are technical
opinions only. The material herein has been obtained
from sources believed to be reliable and accurate, however,
its accuracy and completeness cannot be guaranteed.
This site is not an investment advisor, hence it does
not endorse or recommend any securities or other investments.
Any recommendation contained in this report may not
be suitable for all investors and it is not to be deemed
an offer or solicitation on our part with respect to
the purchase or sale of any securities. All trademarks,
service marks and trade names appearing in this report
are the property of their respective owners, and are
likewise used for identification purposes only.
This report is a service available
only to active Paid Premium Members.
You may opt-out of receiving report notifications
at any time. Questions or comments may be submitted
by writing to Premium Membership Services 665 S.E. 10 Street, Suite 201 Deerfield Beach, FL 33441-5634 or by calling 1-800-965-8307
or 954-785-1121.
|
|
|