You are not logged in.
This means you
CAN ONLY VIEW reports that were published prior to Saturday, February 24, 2024.
You
MUST UPGRADE YOUR MEMBERSHIP if you want to see any current reports.
AFTER MARKET UPDATE - MONDAY, APRIL 25TH, 2022
Previous After Market Report Next After Market Report >>>
|
|
|
|
DOW |
+238.06 |
34,049.46 |
+0.70% |
|
Volume |
1,099,553,078 |
+10% |
|
Volume |
4,748,115,400 |
+8% |
|
NASDAQ |
+165.56 |
13,004.85 |
+1.29% |
|
Advancers |
1,558 |
49% |
|
Advancers |
2,438 |
54% |
|
S&P 500 |
+24.34 |
4,296.12 |
+0.57% |
|
Decliners |
1,614 |
51% |
|
Decliners |
2,103 |
46% |
|
Russell 2000 |
+13.54 |
1,954.20 |
+0.70% |
|
52 Wk Highs |
13 |
|
|
52 Wk Highs |
31 |
|
|
S&P 600 |
+4.02 |
1,264.45 |
+0.32% |
|
52 Wk Lows |
440 |
|
|
52 Wk Lows |
627 |
|
|
Damaging losses last week signaled a market correction (M criteria). Limiting losses and reducing market exposure is prudent until a new confirmed rally is noted.
|
 |
Major Averages Managed a Positive Reversal After Early Weakness
Kenneth J. Gruneisen - Passed the CAN SLIM® Master's Exam
The S&P 500 reversed course to rise 0.6%, while the Nasdaq Composite climbed 1.3%, with both benchmarks recovering from their third straight weekly drawdown and longest such losing streak since January. The Dow recouped a nearly 500-point drop to end 238 points higher. Volume totals reported were higher than the prior session on the NYSE and on the Nasdaq exchange, indicative of an increase in institutional selling pressure termed "distribution". Decliners led advancers by a narrow margin on the NYSE while advancers led decliners by a narrow margin on the Nasdaq exchange. There were no high-ranked companies from the Leaders List that hit new 52-week highs and were listed on the BreakOuts Page, down from 10 on the prior session. New 52-week lows outnumbered shrinking new 52-week highs on both the NYSE and the Nasdaq exchange. The damage to the major indices last week signaled a market correction (M criteria). Strict followers of the fact-based investment system know to use great caution and always be prepared to reduce exposure by selling any weakening stocks on a case-by-case basis.
Chart courtesy of www.stockcharts.com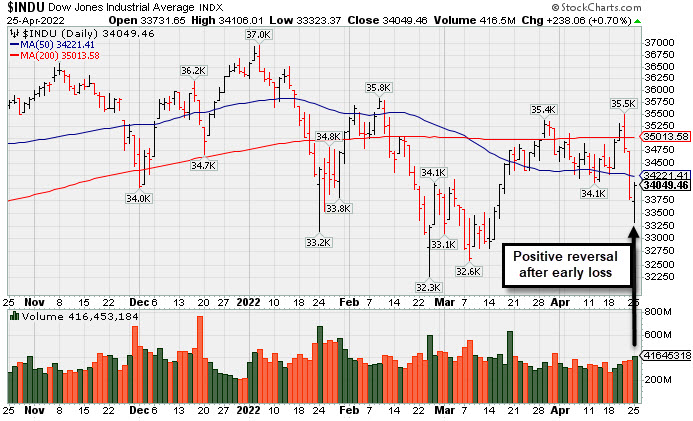 PICTURED: The Dow Jones Industrial Average managed a "positive reversal" on Monday. Last week it abruptly reversed and violated both its 200-day and 50-day moving average (DMA) lines.
U.S. stocks were whipsawed in volatile trading Monday, with the major averages rebounding from early losses. Six of 11 S&P 500 sectors closed in positive territory, with growth-related groups pacing gains. Microsoft Corp. (MSFT +2.44%) and Google parent Alphabet Inc. (GOOGL +2.87%) were among the standouts. This week, these stocks are among the mega-cap tech names headlining the earnings slate, with more than 36% of S&P 500 companies posting results. Energy shares underperformed, with West Texas Intermediate crude falling 2.9% to $99.07/barrel. In other corporate news, Twitter, Inc. (TWTR +5.7%) after its board unanimously agreed to let Elon Musk take the social media company private in a deal worth roughly $44 billion.
Still anxiety over looming central bank rate hikes remains a market overhang as recent remarks from Federal Reserve officials have increased expectations for a swifter path of monetary policy tightening. Also pressuring sentiment were concerns around COVID-19 lockdowns in China, which have entered a fifth week and are exacerbating worries around supply chain issues and the global growth outlook. Overnight, China’s Shanghai Composite retreated 5.1% for its worst session since February 2020.
Perceived safe haven assets caught a bid amid the lingering uncertainty. A gauge of the U.S. dollar jumped 0.5% to its highest level since March 2020, while the yield on the 10-year note slipped eight basis points (0.08%) to 2.82%.
|
 Kenneth J. Gruneisen started out as a licensed stockbroker in August 1987, a couple of months prior to the historic stock market crash that took the Dow Jones Industrial Average down -22.6% in a single day. He has published daily fact-based fundamental and technical analysis on high-ranked stocks online for two decades. Through FACTBASEDINVESTING.COM, Kenneth provides educational articles, news, market commentary, and other information regarding proven investment systems that work in good times and bad.
Comments contained in the body of this report are technical opinions only and are not necessarily those of Gruneisen Growth Corp. The material herein has been obtained from sources believed to be reliable and accurate, however, its accuracy and completeness cannot be guaranteed. Our firm, employees, and customers may effect transactions, including transactions contrary to any recommendation herein, or have positions in the securities mentioned herein or options with respect thereto. Any recommendation contained in this report may not be suitable for all investors and it is not to be deemed an offer or solicitation on our part with respect to the purchase or sale of any securities. |
|
 |
Tech and Retail Indexes Rose; Commodity-Linked Groups Fell
Kenneth J. Gruneisen - Passed the CAN SLIM® Master's Exam
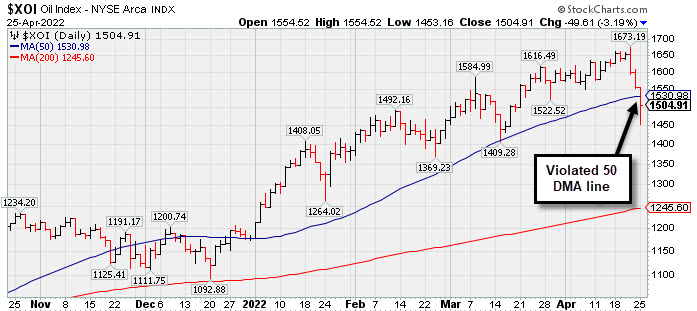
The Semiconductor Index ($SOX +1.76%), Networking Index ($NWX +1.37%), and Biotech Index ($BTK +0.73%) closed the session with gains. The Retail Index ($RLX +1.24%) and Broker/Dealer Index ($XBD +0.71%) both outpaced the Bank Index ($BKX +0.06%). Commodity-linked groups were standout decliners as the Oil Services Index ($OSX -5.39%), and Integrated Oil Index ($XOI -3.19%), and Gold & Silver Index ($XAU -3.53%) each suffered a large loss. PICTURED: The Integrated Oil Index ($XOI -3.19%) violated its 50-day moving average (DMA) line.
| Oil Services |
$OSX |
74.66 |
-4.25 |
-5.39% |
+41.62% |
| Integrated Oil |
$XOI |
1,504.91 |
-49.61 |
-3.19% |
+27.73% |
| Semiconductor |
$SOX |
3,042.39 |
+52.56 |
+1.76% |
-22.90% |
| Networking |
$NWX |
831.29 |
+11.20 |
+1.37% |
-14.40% |
| Broker/Dealer |
$XBD |
429.31 |
+3.01 |
+0.71% |
-11.82% |
| Retail |
$RLX |
3,633.24 |
+44.52 |
+1.24% |
-14.04% |
| Gold & Silver |
$XAU |
145.80 |
-5.34 |
-3.53% |
+10.08% |
| Bank |
$BKX |
116.12 |
+0.07 |
+0.06% |
-12.18% |
| Biotech |
$BTK |
4,927.34 |
+35.63 |
+0.73% |
-10.71% |
|
|
|
 |
|
|
|
Color Codes Explained :
Y - Better candidates highlighted by our
staff of experts.
G - Previously featured
in past reports as yellow but may no longer be buyable under the
guidelines.
***Last / Change / Volume data in this table is the closing quote data***
Symbol/Exchange
Company Name
Industry Group |
PRICE |
CHANGE
(%Change) |
Day High |
Volume
(% DAV)
(% 50 day avg vol) |
52 Wk Hi
% From Hi |
Featured
Date |
Price
Featured |
Pivot Featured |
|
Max Buy |
 REGN
-
NASDAQ
REGN
-
NASDAQ
Regeneron Pharmaceutical
DRUGS - Biotechnology
|
$690.33
|
+2.25
0.33% |
$690.56
|
513,717
77.72% of 50 DAV
50 DAV is 661,000
|
$747.42
-7.64%
|
3/14/2022
|
$647.95
|
PP = $673.96
|
|
MB = $707.66
|
 Most Recent Note - 4/25/2022 5:41:24 PM
Y - Managed "positive reversal" today for a small gain with lighter volume. Prior highs ($686 and $673) define initial support to watch above its 50 DMA line ($667.56).
>>> FEATURED STOCK ARTICLE : Volume Totals Have Been Light While Hovering at All-Time High - 4/4/2022 |
View all notes |
Set NEW NOTE alert |
Company Profile |
SEC
News |
Chart |
Request a new note
C
A
S
I |
IMKTA
-
NASDAQ
Ingles Markets Inc Cl A
RETAIL - Grocery Stores
|
$95.50
|
-0.62
-0.65% |
$95.78
|
107,014
93.87% of 50 DAV
50 DAV is 114,000
|
$101.98
-6.35%
|
4/11/2022
|
$96.25
|
PP = $95.75
|
|
MB = $100.54
|
Most Recent Note - 4/25/2022 5:38:56 PM
Y - Pulled back today for a 4th consecutive loss with lighter than average volume since a "negative reversal" at its 52-week and all-time highs. Highlighted in yellow with pivot point cited based on its 3/21/22 high after a cup-with-high-handle base pattern. Subsequent gains backed by at least +40% above average volume may clinch a convincing technical buy signal. Reported Dec '21 earnings +31% on +17% sales revenues versus the year ago period. Three of the past 4 quarterly comparisons were above the +25% minimum earnings guideline (C criteria). Annual earnings growth (A criteria) has been very strong in recent years.
>>> FEATURED STOCK ARTICLE : Closed Near Session Low and Below Pivot Point Cited - 4/11/2022 |
View all notes |
Set NEW NOTE alert |
Company Profile |
SEC
News |
Chart |
Request a new note
C
A
S
I |
WCC
-
NYSE
Wesco International Inc
WHOLESALE - Electronics Wholesale
|
$125.45
|
-0.23
-0.18% |
$125.68
|
394,966
86.62% of 50 DAV
50 DAV is 456,000
|
$140.92
-10.98%
|
4/21/2022
|
$135.54
|
PP = $139.10
|
|
MB = $146.06
|
Most Recent Note - 4/25/2022 5:46:33 PM
Y - Closed above its 50 and 200 DMA line and near the session high after slumping for big losses with below average volume. Highlighted in the 4/21/22 mid-day report in yellow with pivot point cited based on its 1/05/22 high plus 10 cents. Prior highs in the $139-140 area were stubborn resistance. Subsequent gains above the pivot point backed by at least +40% above average volume may trigger a technical buy signal. Found support near its 200 DMA line in recent weeks. Reported strong Mar, Jun, Sep, and Dec '21 quarterly results versus the year ago periods, well above the +25% minimum guideline. Annual earnings growth has been steady.
>>> FEATURED STOCK ARTICLE : Approaching Prior Highs Where it Met Resistance - 4/21/2022 |
View all notes |
Set NEW NOTE alert |
Company Profile |
SEC
News |
Chart |
Request a new note
C
A
S
I |
SMPL
-
NASDAQ
Simply Good Foods Co
Food-Confectionery
|
$43.15
|
+0.90
2.13% |
$43.15
|
593,390
89.91% of 50 DAV
50 DAV is 660,000
|
$45.77
-5.72%
|
4/13/2022
|
$41.79
|
PP = $43.27
|
|
MB = $45.43
|
Most Recent Note - 4/25/2022 5:44:29 PM
Y - Managed a "positive reversal" today with lighter volume behind its gain, halting its slide from its 52-week high after 3 consecutive losses with above average volume. More damaging losses would raise greater concerns. Reported Feb '22 quarterly earnings +44% on +29% sales revenues versus the year ago period, its 4th strong quarterly comparison.
>>> FEATURED STOCK ARTICLE : Simply Good Foods Had a Great Breakout - 4/14/2022 |
View all notes |
Set NEW NOTE alert |
Company Profile |
SEC
News |
Chart |
Request a new note
C
A
S
I |
IMXI
-
NASDAQ
International Money Exp
Financial Svcs-Specialty
|
$19.98
|
+0.26
1.32% |
$19.99
|
379,105
102.18% of 50 DAV
50 DAV is 371,000
|
$21.98
-9.10%
|
3/8/2022
|
$18.64
|
PP = $19.06
|
|
MB = $20.01
|
Most Recent Note - 4/25/2022 5:40:18 PM
Y - Managed a "positive reversal" today with higher (near average) volume and closed near its "max buy" level. Volume totals had been cooling while consolidating. Prior highs coincide with its 50 DMA line ($18.93) defining important near term support to watch on pullbacks.
>>> FEATURED STOCK ARTICLE : Consolidating After Rally From Previously Noted Base - 4/18/2022 |
View all notes |
Set NEW NOTE alert |
Company Profile |
SEC
News |
Chart |
Request a new note
C
A
S
I |
Symbol/Exchange
Company Name
Industry Group |
PRICE |
CHANGE
(%Change) |
Day High |
Volume
(% DAV)
(% 50 day avg vol) |
52 Wk Hi
% From Hi |
Featured
Date |
Price
Featured |
Pivot Featured |
|
Max Buy |
|
|
|
THESE ARE NOT BUY RECOMMENDATIONS!
Comments contained in the body of this report are technical
opinions only. The material herein has been obtained
from sources believed to be reliable and accurate, however,
its accuracy and completeness cannot be guaranteed.
This site is not an investment advisor, hence it does
not endorse or recommend any securities or other investments.
Any recommendation contained in this report may not
be suitable for all investors and it is not to be deemed
an offer or solicitation on our part with respect to
the purchase or sale of any securities. All trademarks,
service marks and trade names appearing in this report
are the property of their respective owners, and are
likewise used for identification purposes only.
This report is a service available
only to active Paid Premium Members.
You may opt-out of receiving report notifications
at any time. Questions or comments may be submitted
by writing to Premium Membership Services 665 S.E. 10 Street, Suite 201 Deerfield Beach, FL 33441-5634 or by calling 1-800-965-8307
or 954-785-1121.
|
|
|