***Last / Change / Volume data in this table is the closing quote data***
Symbol/Exchange
Company Name
Industry Group |
PRICE |
CHANGE
(%Change) |
Day High |
Volume
(% DAV)
(% 50 day avg vol) |
52 Wk Hi
% From Hi |
Featured
Date |
Price
Featured |
Pivot Featured |
|
Max Buy |
MLR
-
NYSE
Miller Industries Inc
AUTOMOTIVE - Auto Parts
|
$33.89
|
-0.65
-1.88% |
$34.55
|
16,163
39.42% of 50 DAV
50 DAV is 41,000
|
$35.26
-3.89%
|
11/30/2018
|
$28.35
|
PP = $29.50
|
|
MB = $30.98
|
Most Recent Note - 4/23/2019 6:53:42 PM
G - Rebounded above its 50 DMA line ($32.54) to within close striking distance of the prior high. Below the 50 DMA line the prior low ($30.38 on 3/27/19) defines the next near-term support to watch. Reported earnings +17% on +13% sales revenues for the Dec '18 quarter, below the +25% minimum guideline (C criteria), raising fundamental concerns.
>>> FEATURED STOCK ARTICLE : Below 50-Day Average After Damaging Losses - 4/8/2019 |
View all notes |
Set NEW NOTE alert |
Company Profile |
SEC
News |
Chart |
Request a new note
C
A
S
I |
NSP
-
NYSE
Insperity Inc
Comml Svcs-Outsourcing
|
$121.66
|
-1.70
-1.38% |
$122.89
|
309,679
86.50% of 50 DAV
50 DAV is 358,000
|
$132.50
-8.18%
|
4/16/2019
|
$129.59
|
PP = $132.60
|
|
MB = $139.23
|
Most Recent Note - 4/23/2019 6:49:59 PM
G - Due to report earnings news before the open on Monday, April 29, 2019. Volume and volatility often increase near earnings news. A rebound above the 50 DMA line ($125.59) is needed for its outlook to improve. A new pivot point was cited based on its 2/12/19 high plus 10 cents. Subsequent gains above the pivot point backed by at least +40% above average volume may trigger a new (or add-on) technical buy signal. Prior highs in the $118-121 area recently acted as support. See the latest FSU analysis for more details and a new annotated graph.
>>> FEATURED STOCK ARTICLE : Rebound Above 50-Day Moving Average Line Needed - 4/23/2019 |
View all notes |
Set NEW NOTE alert |
Company Profile |
SEC
News |
Chart |
Request a new note
C
A
S
I |
ZBRA
-
NASDAQ
Zebra Tech Corp Cl A
COMPUTER HARDWARE - Computer Peripherals
|
$231.41
|
-4.03
-1.71% |
$235.40
|
423,317
90.45% of 50 DAV
50 DAV is 468,000
|
$237.15
-2.42%
|
2/14/2019
|
$198.10
|
PP = $184.85
|
|
MB = $194.09
|
 Most Recent Note - 4/25/2019 1:29:40 PM
G - Perched at its all-time high, very extended from any sound base. Its 50 DMA line ($212.62) defines near-term support to watch on pullbacks. Due to report earnings results on Tuesday morning, Apr. 30, 2019. Volume and volatility often increase near earnings news.
>>> FEATURED STOCK ARTICLE : Zebra Extended From Prior Base - 3/25/2019 |
View all notes |
Set NEW NOTE alert |
Company Profile |
SEC
News |
Chart |
Request a new note
C
A
S
I |
FTNT
-
NASDAQ
Fortinet Inc
Computer Sftwr-Security
|
$92.90
|
+0.64
0.69% |
$93.38
|
1,399,513
84.26% of 50 DAV
50 DAV is 1,661,000
|
$96.96
-4.19%
|
4/10/2019
|
$89.76
|
PP = $88.70
|
|
MB = $93.14
|
Most Recent Note - 4/25/2019 1:23:42 PM
Y - Consolidating above its pivot point and below its "max buy" level. Tested prior highs in the $88 area defining near-term support above its 50 DMA line ($86.24).
>>> FEATURED STOCK ARTICLE : Volume-Driven Gain Cleared Flat Base and Little Resistance Remains - 4/10/2019 |
View all notes |
Set NEW NOTE alert |
Company Profile |
SEC
News |
Chart |
Request a new note
C
A
S
I |
SPSC
-
NASDAQ
S P S Commerce Inc
COMPUTER SOFTWARE and SERVICES - Application Software
|
$102.52
|
+0.27
0.26% |
$102.89
|
122,695
75.74% of 50 DAV
50 DAV is 162,000
|
$113.31
-9.52%
|
3/26/2019
|
$107.12
|
PP = $113.41
|
|
MB = $119.08
|
Most Recent Note - 4/24/2019 5:45:23 PM
G - Due to report financial results for the first quarter ended March 31, 2019 after the market close on Thursday, April 25, 2019. Volume and volatility often increase near earnings news. It has been sputtering below its 50 DMA line ($105.71) and testing support near prior highs in the $98-100 area. A rebound above the 50 DMA line is needed for its outlook to improve. Subsequent gains above the pivot point backed by at least +40% above average volume may trigger a new (or add-on) technical buy signal.
>>> FEATURED STOCK ARTICLE : Consolidating in Orderly Fashion Above Prior Highs - 3/22/2019 |
View all notes |
Set NEW NOTE alert |
Company Profile |
SEC
News |
Chart |
Request a new note
C
A
S
I |
Symbol/Exchange
Company Name
Industry Group |
PRICE |
CHANGE
(%Change) |
Day High |
Volume
(% DAV)
(% 50 day avg vol) |
52 Wk Hi
% From Hi |
Featured
Date |
Price
Featured |
Pivot Featured |
|
Max Buy |
SSNC
-
NASDAQ
S S & C Technologies
COMPUTER SOFTWARE and SERVICES - Application Software
|
$65.67
|
-0.33
-0.50% |
$66.40
|
943,061
57.09% of 50 DAV
50 DAV is 1,652,000
|
$66.72
-1.57%
|
2/15/2019
|
$59.73
|
PP = $61.07
|
|
MB = $64.12
|
Most Recent Note - 4/23/2019 6:57:56 PM
G - Hit a new all-time high with today's third consecutive gain with volume below average. Its 50 DMA line ($62.14) and prior low define near term support to watch on pullbacks.
>>> FEATURED STOCK ARTICLE : Hovering Near High With Volume Totals Cooling in Recent Weeks - 3/27/2019 |
View all notes |
Set NEW NOTE alert |
Company Profile |
SEC
News |
Chart |
Request a new note
C
A
S
I |
IRBT
-
NASDAQ
Irobot Corp
CONSUMER DURABLES - Electronic Equipment
|
$98.87
|
-1.55
-1.54% |
$104.00
|
2,701,076
300.45% of 50 DAV
50 DAV is 899,000
|
$132.88
-25.59%
|
4/16/2019
|
$130.56
|
PP = $132.98
|
|
MB = $139.63
|
Most Recent Note - 4/25/2019 4:57:14 PM
Fell again today with above average volume violating its 200 DMA line ($99.73). It will be dropped from the Featured Stocks list tonight. Gapped down on the prior session violating its 50 DMA line and recent low ($114.40 on 3/27/19) triggering technical sell signals. The weak action came after reporting earnings -8% on +9% sales revenues for the Mar '19 quarter, raising fundamental concerns.
>>> FEATURED STOCK ARTICLE : Household Appliance Firm Quietly Hovers Near All-Time High - 4/18/2019 |
View all notes |
Set NEW NOTE alert |
Company Profile |
SEC
News |
Chart |
Request a new note
C
A
S
I |
AUDC
-
NASDAQ
Audiocodes Ltd
ELECTRONICS - Scientific and Technical Instrum
|
$16.67
|
-0.22
-1.30% |
$16.84
|
128,316
64.81% of 50 DAV
50 DAV is 198,000
|
$17.10
-2.51%
|
3/20/2019
|
$13.66
|
PP = $15.06
|
|
MB = $15.81
|
Most Recent Note - 4/23/2019 12:11:51 PM
G - Color code is changed to green after rising above its "max buy" level and getting extended from the prior base. Prior high ($14.96) defines initial support to watch above its 50 DMA line ($14.12).
>>> FEATURED STOCK ARTICLE : Building a Base and Found Support Near 50-Day Moving Average - 3/20/2019 |
View all notes |
Set NEW NOTE alert |
Company Profile |
SEC
News |
Chart |
Request a new note
C
A
S
I |
ENV
-
NYSE
Envestnet Inc
FINANCIAL SERVICES - Diversified Investments
|
$70.83
|
+0.13
0.18% |
$72.39
|
535,965
170.15% of 50 DAV
50 DAV is 315,000
|
$71.85
-1.42%
|
3/15/2019
|
$66.05
|
PP = $64.90
|
|
MB = $68.15
|
Most Recent Note - 4/24/2019 5:36:55 PM
G - Extended from any sound base, it hit another new all-time high today but reversed into the red. The recent low ($63.34 on 3/27/19) and 50 DMA line ($63.95) define near-term support to watch on pullbacks. See the latest FSU analysis for more details and a new annotated graph.
>>> FEATURED STOCK ARTICLE : Negative Reversal After Another New High - 4/24/2019 |
View all notes |
Set NEW NOTE alert |
Company Profile |
SEC
News |
Chart |
Request a new note
C
A
S
I |
LHCG
-
NASDAQ
L H C Group Inc
HEALTH SERVICES - Home Health Care
|
$108.72
|
+0.86
0.80% |
$109.87
|
120,749
45.74% of 50 DAV
50 DAV is 264,000
|
$115.54
-5.90%
|
1/23/2019
|
$107.29
|
PP = $107.61
|
|
MB = $112.99
|
Most Recent Note - 4/23/2019 7:00:51 PM
G - Found prompt support at its 200 DMA line ($99.33) and posted a volume-driven gain today. Disciplined investors always limit losses by selling any stock that falls more than -7% from their purchase price. A rebound above the 50 DMA line ($108.79) is needed for its outlook to improve.
>>> FEATURED STOCK ARTICLE : Sputtering Near 50-Day Moving Average Line - 4/1/2019 |
View all notes |
Set NEW NOTE alert |
Company Profile |
SEC
News |
Chart |
Request a new note
C
A
S
I |
Symbol/Exchange
Company Name
Industry Group |
PRICE |
CHANGE
(%Change) |
Day High |
Volume
(% DAV)
(% 50 day avg vol) |
52 Wk Hi
% From Hi |
Featured
Date |
Price
Featured |
Pivot Featured |
|
Max Buy |
ENSG
-
NASDAQ
Ensign Group Inc
HEALTH SERVICES - Long-Term Care Facilities
|
$50.55
|
+0.04
0.08% |
$50.83
|
243,549
80.91% of 50 DAV
50 DAV is 301,000
|
$54.56
-7.35%
|
2/7/2019
|
$48.71
|
PP = $49.06
|
|
MB = $51.51
|
Most Recent Note - 4/23/2019 7:04:19 PM
G - Rebounded near its 50 DMA line ($50.44) with light volume behind today's 3rd consecutive gain. That important short-term average may act as resistance. A convincing rebound above the 50 DMA line would help its outlook improve.
>>> FEATURED STOCK ARTICLE : Two Damaging Losses Hurt Outlook - 4/17/2019 |
View all notes |
Set NEW NOTE alert |
Company Profile |
SEC
News |
Chart |
Request a new note
C
A
S
I |
LULU
-
NASDAQ
Lululemon Athletica
MANUFACTURING - Textile Manufacturing
|
$177.29
|
-0.98
-0.55% |
$179.22
|
1,666,372
71.36% of 50 DAV
50 DAV is 2,335,000
|
$177.16
0.07%
|
3/28/2019
|
$169.20
|
PP = $164.89
|
|
MB = $173.13
|
Most Recent Note - 4/22/2019 5:42:44 PM
Y - Quietly perched near its all-time high and the previously noted "max buy" level. Stubbornly holding its ground since a "breakaway gap" on 3/28/19 triggered a technical buy signal. Prior highs define initial support to watch above its 50 DMA line ($155).
>>> FEATURED STOCK ARTICLE : Breakway Gap Backed by More Than 6 Times Average Volume - 3/28/2019 |
View all notes |
Set NEW NOTE alert |
Company Profile |
SEC
News |
Chart |
Request a new note
C
A
S
I |
NXST
-
NASDAQ
Nexstar Media Group Cl A
MEDIA - Broadcasting - TV
|
$116.43
|
+0.73
0.63% |
$117.15
|
284,930
50.25% of 50 DAV
50 DAV is 567,000
|
$119.93
-2.92%
|
2/26/2019
|
$94.26
|
PP = $89.76
|
|
MB = $94.25
|
Most Recent Note - 4/25/2019 1:24:51 PM
G - Quietly hovering near its all-time high, very extended from any sound base. Disciplined investors avoid chasing stocks more than +5% above the prior high. Its 50 DMA line ($105.46) defines near-term support to watch on pullbacks.
>>> FEATURED STOCK ARTICLE : Hitting New High and Very Extended From Prior Base - 4/4/2019 |
View all notes |
Set NEW NOTE alert |
Company Profile |
SEC
News |
Chart |
Request a new note
C
A
S
I |
ULTA
-
NASDAQ
Ulta Beauty Inc
SPECIALTY RETAIL - Specialty Retail, Other
|
$353.70
|
-2.14
-0.60% |
$355.34
|
393,847
51.28% of 50 DAV
50 DAV is 768,000
|
$359.69
-1.67%
|
3/15/2019
|
$341.27
|
PP = $322.59
|
|
MB = $338.72
|
Most Recent Note - 4/25/2019 1:27:05 PM
G - Volume totals have been lighter than average every session for the past 4 weeks while stubbornly holding its ground near its all-time high. Its 50 DMA line ($331) defines near term support above prior highs.
>>> FEATURED STOCK ARTICLE : Consolidating Following Big "Breakaway Gap" - 3/19/2019 |
View all notes |
Set NEW NOTE alert |
Company Profile |
SEC
News |
Chart |
Request a new note
C
A
S
I |
UBNT
-
NASDAQ
Ubiquiti Networks
TELECOMMUNICATIONS - Diversified Communication Serv
|
$166.79
|
-1.56
-0.93% |
$168.30
|
496,987
141.59% of 50 DAV
50 DAV is 351,000
|
$174.95
-4.66%
|
2/8/2019
|
$121.97
|
PP = $115.54
|
|
MB = $121.32
|
Most Recent Note - 4/25/2019 1:15:11 PM
G - Pulling back from its all-time high after getting very extended from any sound base. Its 50 DMA line ($150.70) and prior high ($148.68 on 2/27/19) define near-term support to watch. Fundamentals remain strong.
>>> FEATURED STOCK ARTICLE : Extended From Any Sound Bass and Wedging to New Highs - 4/12/2019 |
View all notes |
Set NEW NOTE alert |
Company Profile |
SEC
News |
Chart |
Request a new note
C
A
S
I |
Symbol/Exchange
Company Name
Industry Group |
PRICE |
CHANGE
(%Change) |
Day High |
Volume
(% DAV)
(% 50 day avg vol) |
52 Wk Hi
% From Hi |
Featured
Date |
Price
Featured |
Pivot Featured |
|
Max Buy |
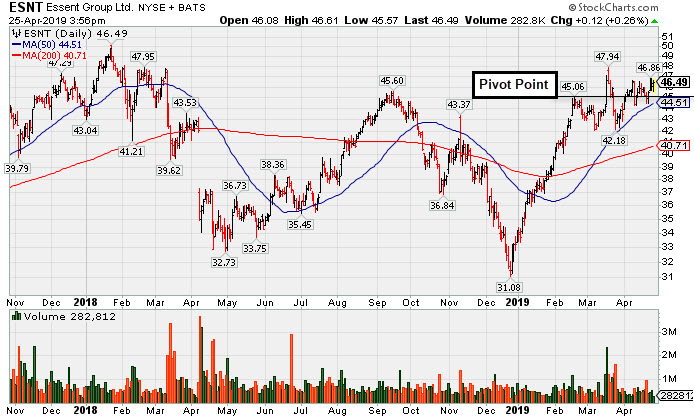
ESNT
-
NYSE
Essent Group Ltd
Finance-MrtgandRel Svc
|
$46.44
|
+0.07
0.15% |
$46.62
|
399,971
63.49% of 50 DAV
50 DAV is 630,000
|
$47.94
-3.13%
|
3/18/2019
|
$45.84
|
PP = $45.06
|
|
MB = $47.31
|
Most Recent Note - 4/25/2019 4:44:25 PM
Y - Posted 4 consecutive gains with light volume. Found support above its 50 DMA line ($44.50) reassuringly during the recent consolidation. Still faces some resistance due to overhead supply up to the $50 level. Due to report earnings news on May 3rd. See the latest FSU analysis for more details and a new annotated graph.
>>> FEATURED STOCK ARTICLE : Perched Above Pivot Point With Earnings News Due May 3rd - 4/25/2019 |
View all notes |
Set NEW NOTE alert |
Company Profile |
SEC
News |
Chart |
Request a new note
C
A
S
I |
FIVE
-
NASDAQ
Five Below Inc
Retail-DiscountandVariety
|
$145.50
|
-0.55
-0.38% |
$147.43
|
814,798
74.55% of 50 DAV
50 DAV is 1,093,000
|
$144.01
1.03%
|
4/11/2019
|
$132.05
|
PP = $133.75
|
|
MB = $140.44
|
Most Recent Note - 4/24/2019 5:39:53 PM
G - Color code is changed to green after hitting another new all-time high beyond its "max buy" level with today's 10th consecutive gain. Recent gains have lacked great volume conviction. Prior highs in the $133-136 area define initioal support to watch on pullbacks.
>>> FEATURED STOCK ARTICLE : Finished Strong After Featured Again in Mid-Day Report - 4/11/2019 |
View all notes |
Set NEW NOTE alert |
Company Profile |
SEC
News |
Chart |
Request a new note
C
A
S
I |
NOW
-
NYSE
Servicenow Inc
Computer Sftwr-Enterprse
|
$260.69
|
+17.99
7.41% |
$269.27
|
4,749,986
270.35% of 50 DAV
50 DAV is 1,757,000
|
$251.65
3.59%
|
4/22/2019
|
$242.64
|
PP = $251.75
|
|
MB = $264.34
|
Most Recent Note - 4/25/2019 12:56:47 PM
Y - Gapped up today hitting a new all-time high. The gain above the pivot point triggered a new (or add-on) technical buy signal. Reported earnings +20% on +34% sales revenues for the Mar '19 quarter, below the +25% minimum earnings guideline (C criteria) raising concerns, fundamentally. Found support prompt near the 50 DMA line. Prior lows ($230.14 on 4/04/19 and $226.71 on 3/08/19) define near-term support to watch.
>>> FEATURED STOCK ARTICLE : Found Recent Support at 50-Day Moving Average - 4/15/2019 |
View all notes |
Set NEW NOTE alert |
Company Profile |
SEC
News |
Chart |
Request a new note
C
A
S
I |
PANW
-
NYSE
Palo Alto Networks
Computer Sftwr-Security
|
$245.46
|
+2.35
0.97% |
$246.58
|
876,332
63.92% of 50 DAV
50 DAV is 1,371,000
|
$260.63
-5.82%
|
2/25/2019
|
$233.54
|
PP = $239.60
|
|
MB = $251.58
|
Most Recent Note - 4/22/2019 5:58:37 PM
Y - Posted a gain today with lighter volume, finding support near its 50 DMA line ($238.21) and the prior low ($233.15 on 4/04/19). Fundamentals remain strong.
>>> FEATURED STOCK ARTICLE : Consolidating Above Prior High and 50-Day Average - 4/3/2019 |
View all notes |
Set NEW NOTE alert |
Company Profile |
SEC
News |
Chart |
Request a new note
C
A
S
I |
ANET
-
NYSE
Arista Networks Inc
TELECOMMUNICATIONS - Communication Equipment
|
$318.11
|
-7.12
-2.19% |
$324.61
|
700,404
78.52% of 50 DAV
50 DAV is 892,000
|
$331.27
-3.97%
|
3/13/2019
|
$295.38
|
PP = $313.37
|
|
MB = $329.04
|
Most Recent Note - 4/25/2019 1:32:46 PM
Y - Due to report earnings news on May 2nd after the close. Volume and volatility often increase near earnings news. It is consolidating above the pivot point and below the "max buy" level previously noted.
>>> FEATURED STOCK ARTICLE : Hovering Near High With Volume Totals Cooling - 4/22/2019 |
View all notes |
Set NEW NOTE alert |
Company Profile |
SEC
News |
Chart |
Request a new note
C
A
S
I |
Symbol/Exchange
Company Name
Industry Group |
PRICE |
CHANGE
(%Change) |
Day High |
Volume
(% DAV)
(% 50 day avg vol) |
52 Wk Hi
% From Hi |
Featured
Date |
Price
Featured |
Pivot Featured |
|
Max Buy |
PAYC
-
NYSE
Paycom Software Inc
COMPUTER SOFTWARE and SERVICES - Application Software
|
$196.54
|
+3.94
2.05% |
$197.33
|
512,880
88.89% of 50 DAV
50 DAV is 577,000
|
$196.41
0.07%
|
2/6/2019
|
$171.66
|
PP = $164.18
|
|
MB = $172.39
|
Most Recent Note - 4/24/2019 12:44:51 PM
G - Due to report earnings for the Mar '19 quarter after the market closes on Tuesday, April 30. Recently wedged higher with gains lacking great volume conviction while it did not form a sound new base of sufficient length. Held its ground at its 50 DMA line ($183.64) which defines important near-term support to watch above recent lows.
>>> FEATURED STOCK ARTICLE : Paycom Software Quietly Hovering Near All-Time High - 4/16/2019 |
View all notes |
Set NEW NOTE alert |
Company Profile |
SEC
News |
Chart |
Request a new note
C
A
S
I |
PYPL
-
NASDAQ
Paypal Holdings Inc
Finance-CrdtCard/PmtPr
|
$110.22
|
+3.00
2.80% |
$110.92
|
10,723,500
162.70% of 50 DAV
50 DAV is 6,591,000
|
$109.00
1.12%
|
1/24/2019
|
$92.56
|
PP = $93.80
|
|
MB = $98.49
|
Most Recent Note - 4/25/2019 1:03:14 PM
G - Powering to another new all-time high with today's 3rd consecutive volume-driven gain. Very extended from any sound base. Well above its 50 DMA line ($101.54) which defines support to watch.
>>> FEATURED STOCK ARTICLE : Extended From Base After Gains in Recent Weeks Lacking Volume - 4/2/2019 |
View all notes |
Set NEW NOTE alert |
Company Profile |
SEC
News |
Chart |
Request a new note
C
A
S
I |
ALRM
-
NASDAQ
Alarm.com Holdings Inc
Security/Sfty
|
$70.83
|
+0.47
0.67% |
$71.46
|
184,782
42.67% of 50 DAV
50 DAV is 433,000
|
$71.18
-0.49%
|
1/22/2019
|
$60.52
|
PP = $60.30
|
|
MB = $63.32
|
Most Recent Note - 4/22/2019 5:50:00 PM
G - Posted a gain today with light volume. Recently wedging to new highs with gains lacking great volume conviction. Found prompt support near the 50 DMA line after it reported earnings +12% on +25% sales revenues for the Dec '18 quarter, below the +25% minimum earnings guideline (C criteria), raising fundamental concerns.
>>> FEATURED STOCK ARTICLE : Consolidating Near 50-Day Average Following Sub Par Report - 3/29/2019 |
View all notes |
Set NEW NOTE alert |
Company Profile |
SEC
News |
Chart |
Request a new note
C
A
S
I |
PLNT
-
NYSE
Planet Fitness Inc Cl A
Leisure-Services
|
$75.45
|
+0.42
0.56% |
$75.65
|
1,328,042
93.66% of 50 DAV
50 DAV is 1,418,000
|
$75.35
0.13%
|
11/7/2018
|
$57.10
|
PP = $55.45
|
|
MB = $58.22
|
Most Recent Note - 4/24/2019 5:50:26 PM
G - Hit yet another new all-time high with today's volume-driven gain. Very extended from any sound base. Its 50 DMA line (66.21) defines near-term support to watch on pullbacks. Fundamentals remain strong.
>>> FEATURED STOCK ARTICLE : Perched Near High Very Extended From Prior Base - 4/5/2019 |
View all notes |
Set NEW NOTE alert |
Company Profile |
SEC
News |
Chart |
Request a new note
C
A
S
I |
TEAM
-
NASDAQ
Atlassian Corp Plc Cl A
Comp Sftwr-Spec Enterprs
|
$106.00
|
+2.83
2.74% |
$106.07
|
1,459,583
87.04% of 50 DAV
50 DAV is 1,677,000
|
$117.06
-9.45%
|
4/16/2019
|
$114.77
|
PP = $116.80
|
|
MB = $122.64
|
Most Recent Note - 4/24/2019 5:52:33 PM
G - Reversed into the red today. The 50 DMA line may act as resistance, but a rebound above the 50 DMA line ($108.83) is needed for its outlook to improve. Reported earnings +133% on +38% sales revenues for the Mar '19 quarter, continuing its strong earnings track record.
>>> FEATURED STOCK ARTICLE : Perched Near High Enduring Distributional Pressure - 4/9/2019 |
View all notes |
Set NEW NOTE alert |
Company Profile |
SEC
News |
Chart |
Request a new note
C
A
S
I |
Symbol/Exchange
Company Name
Industry Group |
PRICE |
CHANGE
(%Change) |
Day High |
Volume
(% DAV)
(% 50 day avg vol) |
52 Wk Hi
% From Hi |
Featured
Date |
Price
Featured |
Pivot Featured |
|
Max Buy |
GLOB
-
NYSE
Globant SA
Computer-Tech Services
|
$80.84
|
-1.97
-2.38% |
$83.02
|
160,349
77.09% of 50 DAV
50 DAV is 208,000
|
$83.75
-3.47%
|
2/15/2019
|
$69.35
|
PP = $70.00
|
|
MB = $73.50
|
Most Recent Note - 4/24/2019 12:37:16 PM
G - Pulling back today after a big gain with above average volume for a new all-time high on the prior session. Very extended from any sound base. Near-term support is at its prior high ($74) and its 50 DMA line ($72.79). Violations would raise concerns and trigger technical sell signals.
>>> FEATURED STOCK ARTICLE : Consolidating Near 50-Day Average Quietly Perched Near High - 3/26/2019 |
View all notes |
Set NEW NOTE alert |
Company Profile |
SEC
News |
Chart |
Request a new note
C
A
S
I |
TTD
-
NASDAQ
The Trade Desk Inc Cl A
Comml Svcs-Advertising
|
$214.75
|
+6.96
3.35% |
$216.88
|
1,020,449
63.15% of 50 DAV
50 DAV is 1,616,000
|
$215.00
-0.12%
|
4/22/2019
|
$211.03
|
PP = $214.80
|
|
MB = $225.54
|
Most Recent Note - 4/25/2019 1:37:01 PM
Y - Quietly touched a new all-time high today. A gain and close above the pivot point backed by at least +40% above average volume may trigger a new (or add-on) technical buy signal. Consolidated in an orderly fashion above its 50 DMA line ($194) which defines initial support to watch above the prior low ($178.30 on 3/27/19). Due to report earnings news before the open on 5/09/19.
>>> FEATURED STOCK ARTICLE : Hit Another New All-Time High Getting Extended From Prior Base - 3/21/2019 |
View all notes |
Set NEW NOTE alert |
Company Profile |
SEC
News |
Chart |
Request a new note
C
A
S
I |