You are not logged in.
This means you
CAN ONLY VIEW reports that were published prior to Sunday, February 25, 2024.
You
MUST UPGRADE YOUR MEMBERSHIP if you want to see any current reports.
AFTER MARKET UPDATE - FRIDAY, APRIL 24TH, 2020
Previous After Market Report Next After Market Report >>>
|
|
|
|
DOW |
+260.01 |
23,775.27 |
+1.11% |
|
Volume |
1,058,921,969 |
+0% |
|
Volume |
3,633,780,000 |
-2% |
|
NASDAQ |
+139.77 |
8,634.52 |
+1.65% |
|
Advancers |
1,799 |
62% |
|
Advancers |
2,098 |
65% |
|
S&P 500 |
+38.94 |
2,836.74 |
+1.39% |
|
Decliners |
1,085 |
38% |
|
Decliners |
1,115 |
35% |
|
Russell 2000 |
+18.99 |
1,233.05 |
+1.56% |
|
52 Wk Highs |
14 |
|
|
52 Wk Highs |
39 |
|
|
S&P 600 |
+7.65 |
715.14 |
+1.08% |
|
52 Wk Lows |
23 |
|
|
52 Wk Lows |
23 |
|
|
 |
Breadth Positive as Major Indices Hold Their Ground
Kenneth J. Gruneisen - Passed the CAN SLIM® Master's Exam
The Dow climbed 260 points, paring its weekly decline to 1.9%. The S&P 500 rose 1.4%, but fell 1.3% for the week. The Nasdaq Composite jumped 1.7%, trimming the Tech-heavy index’s weekly loss to just 0.2%. Breadth was positive as advancers led decliners by a 3-2 margin on the NYSE and nearly 2-1 on the Nasdaq exchange. The reported volume totals were near the prior session on the NYSE and slightly lower on the Nasdaq exchange. There were 17 high-ranked companies from the Leaders List hit new 52-week highs and were listed on the BreakOuts Page, versus 23 on the prior session. New 52-week lows outnumbered the new 52-week highs on the NYSE while new highs outnumbered new lows on the Nasdaq exchange. The follow-through day of big confirming gains on Monday, April 6th from the major indices on higher volume, coupled with an increase in the number of stocks hitting new highs, signaled a valid new market uptrend (M criteria). Any sustainable rally requires a healthy crop of new leaders, so it is important to see continued improvement in this area. Charts used courtesy of www.stockcharts.com
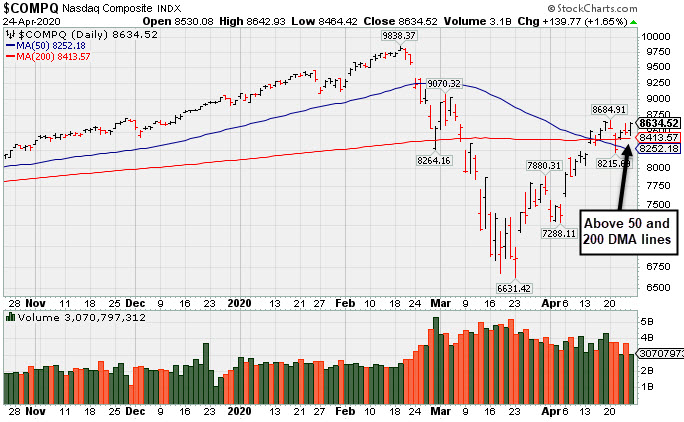
PICTURED: The Nasdaq Composite Index has holding its ground after rebounding above its 50-day and 200-day moving average (DMA) lines.
Stocks finished higher on Friday, capping a turbulent week on Wall Street fueled by volatile oil prices, mixed corporate earnings results and economic data pointing to a downbeat economy. Investors also digested the latest fiscal stimulus measures. President Trump signed a $484 billion coronavirus relief bill, which was the fourth such aid package from Congress.
All 11 S&P 500 sectors are finished in positive territory, with seven groups adding more than 1%. Technology shares paced the gains, with Apple (AAPL +2.89%). Intel (INTC 0.37%) edged higher after the chipmaker posted an earnings beat, but failed to update its full-year guidance. The Financials group also outperformed, with Capital One (COF +6.73%) following positive analyst comments. In other corporate news, Boeing (BA -6.35%) fell following reports the company is cutting production of its Dreamliner aircraft in half.
Treasuries advanced along the curve, with the yield on the benchmark 10-year note off one basis point to 0.59%. On the data front, a report showed durable goods orders slumped more than expected in March, falling 14.4%. A separate release from the University of Michigan indicated consumer sentiment improved modestly, with the final reading of the gauge ticking up to 71.8 in April, above the prior reading of 71.0 and forecasts of 68.0. In commodities, WTI crude added 3.6% to $17.10/barrel, paring its weekly decline to 6.8%. |
 Kenneth J. Gruneisen started out as a licensed stockbroker in August 1987, a couple of months prior to the historic stock market crash that took the Dow Jones Industrial Average down -22.6% in a single day. He has published daily fact-based fundamental and technical analysis on high-ranked stocks online for two decades. Through FACTBASEDINVESTING.COM, Kenneth provides educational articles, news, market commentary, and other information regarding proven investment systems that work in good times and bad.
Comments contained in the body of this report are technical opinions only and are not necessarily those of Gruneisen Growth Corp. The material herein has been obtained from sources believed to be reliable and accurate, however, its accuracy and completeness cannot be guaranteed. Our firm, employees, and customers may effect transactions, including transactions contrary to any recommendation herein, or have positions in the securities mentioned herein or options with respect thereto. Any recommendation contained in this report may not be suitable for all investors and it is not to be deemed an offer or solicitation on our part with respect to the purchase or sale of any securities. |
|
 |
Tech, Retail, Financial, and Gold & Silver index Rose
Kenneth J. Gruneisen - Passed the CAN SLIM® Master's Exam
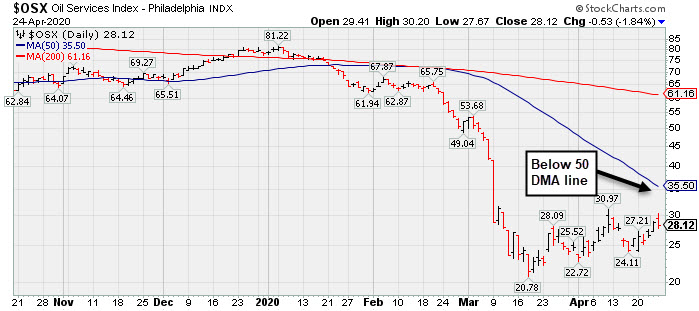
Commodity-linked groups were mixed as the Gold & Silver Index ($XAU +2.00%) rose and the Oil Services Index ($OSX -1.84%) fell while the Integrated Oil Index ($XOI -0.19%) was little changed. The tech sector had a positive bias as the Semiconductor Index ($SOX +2.28%), Networking Index ($NWX +1.78%), and the Biotech Index ($BTK +2.00%) each finished solidly higher. The Retail Index ($XBD +1.59%) and financials had a positive bias as the Bank Index ($BKX +2.15%) and the Broker/Dealer Index ($XBD +0.62%) rose. PICTURED: The Oil Services Index ($OSX -1.84%) is still sputtering below its 50-day moving average (DMA) line after rebounding from its March 2020 low.
| Oil Services |
$OSX |
28.12 |
-0.53 |
-1.85% |
-64.08% |
| Integrated Oil |
$XOI |
700.16 |
-1.30 |
-0.19% |
-44.89% |
| Semiconductor |
$SOX |
1,702.56 |
+37.89 |
+2.28% |
-7.95% |
| Networking |
$NWX |
511.21 |
+8.96 |
+1.78% |
-12.38% |
| Broker/Dealer |
$XBD |
224.77 |
+1.40 |
+0.62% |
-22.60% |
| Retail |
$RLX |
2,590.60 |
+40.48 |
+1.59% |
+5.77% |
| Gold & Silver |
$XAU |
117.55 |
+2.30 |
+2.00% |
+9.94% |
| Bank |
$BKX |
69.03 |
+1.45 |
+2.15% |
-39.11% |
| Biotech |
$BTK |
5,312.78 |
+104.32 |
+2.00% |
+4.84% |
|
|
|
 |
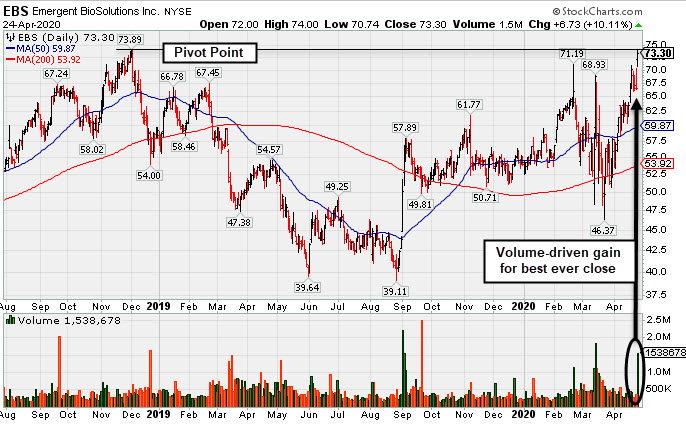
Volume-Driven Gain for Vaccine Maker With Great Earnings History
Kenneth J. Gruneisen - Passed the CAN SLIM® Master's Exam
Emergent Biosolutions (EBS +$6.73 or +10.11% to $73.30) finished strong after highlighted in yellow with pivot point cited based on its December 2018 high in the earlier mid-day report (read here). It gapped up hitting a new 52-week high and touched a new all-time high today (N criteria). Subsequent gains and strong close above the pivot point backed by at least +40% above average volume may help to clinch a convincing technical buy signal.
It currently has a 90 Earnings Per Share Rating, putting it in the top 10% of all publicly traded companies based on its earnings history. Keep in mind it is due to report Mar '20 earnings news on 4/30/20. Volume and volatility often increase near earnings news. It reported earnings +101% on +33% sales revenues for the Dec '19 quarter, its 2nd strong quarterly comparison versus the year ago period. Annual earnings history (A criteria) has been strong since a downturn in FY '16.
It has a small supply (S criteria) of only 44.9 million shares in the publicly traded float which can contribute to greater price volatility in the event of institutional buying or selling. The number of top-rated funds owning its shares fell from 461 in Dec '19 to 449 in Mar '20, however its current Up/Down Volume Ratio of 1.3 is an unbiased indication its shares have been under accumulation over the past 50 days. It has an A Timeliness rating and a B+ Accumulation/Distribution rating. The company is in the Medical - Biomed/Biotech industry group which is a leading group currently ranked 5th out of the 197 industry groups (L criteria).
|
|
|
Color Codes Explained :
Y - Better candidates highlighted by our
staff of experts.
G - Previously featured
in past reports as yellow but may no longer be buyable under the
guidelines.
***Last / Change / Volume data in this table is the closing quote data***
Symbol/Exchange
Company Name
Industry Group |
PRICE |
CHANGE
(%Change) |
Day High |
Volume
(% DAV)
(% 50 day avg vol) |
52 Wk Hi
% From Hi |
Featured
Date |
Price
Featured |
Pivot Featured |
|
Max Buy |
 EBS
-
NYSE
EBS
-
NYSE
Emergent Biosolutions
DRUGS - Biotechnology
|
$73.30
|
+6.73
10.11% |
$74.00
|
1,538,601
293.07% of 50 DAV
50 DAV is 525,000
|
$71.19
2.96%
|
4/24/2020
|
$72.10
|
PP = $73.99
|
|
MB = $77.69
|
 Most Recent Note - 4/24/2020 6:39:36 PM
Y - Finished in the upper third of its intra-day range today with a solid gain backed by +193% above average volume. Highlighted in yellow with pivot point cited based on its December 2018 high in the earlier mid-day report. Gapped up hitting a new 52-week high and touched a new all-time high. Subsequent gains and a strong close above the pivot point backed by at least +40% above average volume may trigger a technical buy signal. Due to report Mar '20 earnings news on 4/30/20. Reported earnings +101% on +33% sales revenues for the Dec '19 quarter, its 2nd strong quarterly comparison versus the year ago period. Annual earnings history (A criteria) has improved following a downturn in FY '16. See the latest FSU analysis for more details and a new annotated graph.
>>> FEATURED STOCK ARTICLE : Volume-Driven Gain for Vaccine Maker With Great Earnings History - 4/24/2020 |
View all notes |
Set NEW NOTE alert |
Company Profile |
SEC
News |
Chart |
Request a new note
C
A
S
I |
NFLX
-
NASDAQ
Netflix Inc
SPECIALTY RETAIL - Music and Video Stores
|
$424.99
|
-1.71
-0.40% |
$427.17
|
8,640,440
93.95% of 50 DAV
50 DAV is 9,197,000
|
$449.52
-5.46%
|
4/13/2020
|
$393.60
|
PP = $393.62
|
|
MB = $413.30
|
Most Recent Note - 4/24/2020 6:40:56 PM
G - Volume was lighter today while still hovering near its all-time high, extended from the previously noted base. Reported earnings +107% on +28% sales revenues for the Mar '20 quarter versus the year ago period. Disciplined investors avoid chasing stocks more than +5% above the prior high or pivot point.
>>> FEATURED STOCK ARTICLE : Netflix Reported Another Strong Quarter After Rally From Base - 4/21/2020 |
View all notes |
Set NEW NOTE alert |
Company Profile |
SEC
News |
Chart |
Request a new note
C
A
S
I |
QLYS
-
NASDAQ
Qualys Inc
Computer Sftwr-Security
|
$109.26
|
+3.14
2.96% |
$110.00
|
289,199
53.85% of 50 DAV
50 DAV is 537,000
|
$110.89
-1.47%
|
4/9/2020
|
$100.44
|
PP = $97.22
|
|
MB = $102.08
|
Most Recent Note - 4/24/2020 6:41:55 PM
G - Posted a gain with lighter than average volume today for a best ever close near its all-time high. Very extended from the previously noted base. Prior highs in the $97 area define initial support to watch on pullbacks.
>>> FEATURED STOCK ARTICLE : Volume-Driven Breakout Indicative of Institutional Buying Demand - 4/9/2020 |
View all notes |
Set NEW NOTE alert |
Company Profile |
SEC
News |
Chart |
Request a new note
C
A
S
I |
|
|
|
THESE ARE NOT BUY RECOMMENDATIONS!
Comments contained in the body of this report are technical
opinions only. The material herein has been obtained
from sources believed to be reliable and accurate, however,
its accuracy and completeness cannot be guaranteed.
This site is not an investment advisor, hence it does
not endorse or recommend any securities or other investments.
Any recommendation contained in this report may not
be suitable for all investors and it is not to be deemed
an offer or solicitation on our part with respect to
the purchase or sale of any securities. All trademarks,
service marks and trade names appearing in this report
are the property of their respective owners, and are
likewise used for identification purposes only.
This report is a service available
only to active Paid Premium Members.
You may opt-out of receiving report notifications
at any time. Questions or comments may be submitted
by writing to Premium Membership Services 665 S.E. 10 Street, Suite 201 Deerfield Beach, FL 33441-5634 or by calling 1-800-965-8307
or 954-785-1121.
|
|
|