You are not logged in.
This means you
CAN ONLY VIEW reports that were published prior to Sunday, February 25, 2024.
You
MUST UPGRADE YOUR MEMBERSHIP if you want to see any current reports.
AFTER MARKET UPDATE - THURSDAY, APRIL 23RD, 2020
Previous After Market Report Next After Market Report >>>
|
|
|
|
DOW |
+39.44 |
23,515.26 |
+0.17% |
|
Volume |
1,057,219,814 |
+3% |
|
Volume |
3,704,653,600 |
+23% |
|
NASDAQ |
-0.63 |
8,494.75 |
-0.01% |
|
Advancers |
1,757 |
61% |
|
Advancers |
1,934 |
61% |
|
S&P 500 |
-1.51 |
2,797.80 |
-0.05% |
|
Decliners |
1,104 |
39% |
|
Decliners |
1,254 |
39% |
|
Russell 2000 |
+12.54 |
1,214.06 |
+1.04% |
|
52 Wk Highs |
21 |
|
|
52 Wk Highs |
38 |
|
|
S&P 600 |
+8.75 |
707.49 |
+1.25% |
|
52 Wk Lows |
18 |
|
|
52 Wk Lows |
24 |
|
|
 |
Major Indices Trimmed Early Gains
Kenneth J. Gruneisen - Passed the CAN SLIM® Master's Exam
The Dow gained 39 points, while the S&P 500 ticked down 0.1%, paring mid-day gains of more than 1.5%. The Nasdaq Composite ended the day unchanged. Breadth was positive as advancers led decliners by a 3-2 margin on the NYSE and on the Nasdaq exchange. The reported volume totals were higher than the prior session on the NYSE and on the Nasdaq exchange. There were 23 high-ranked companies from the Leaders List hit new 52-week highs and were listed on the BreakOuts Page, versus 18 on the prior session. New 52-week highs outnumbered the new 52-week lows on the NYSE and on the Nasdaq exchange. The follow-through day of big confirming gains on Monday, April 6th from the major indices on higher volume, coupled with an increase in the number of stocks hitting new highs, signaled a valid new market uptrend (M criteria). Any sustainable rally requires a healthy crop of new leaders, so it is important to see continued improvement in this area. Charts used courtesy of www.stockcharts.com
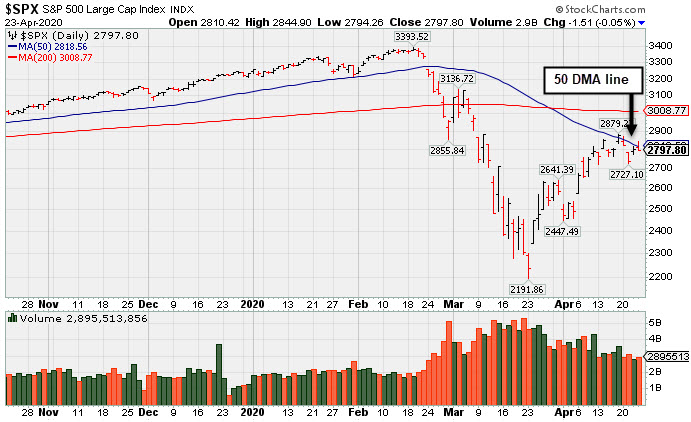
PICTURED: The S&P 500 Index has been meeting resistance at its 50-day moving average (DMA) line.
Stocks finished mixed Thursday, as investors assessed economic reports, rebounding oil prices, and COVID-19 updates. Equities were whipsawed after the Financial Times published a report that the Gilead Science (GILD -4.34%) coronavirus treatment, Remdesivir, flopped in a clinical trial. However, the Biotech company disputed the study, claiming results were “inconclusive” due to low enrollment.
Five of 11 S&P 500 sectors finished the session in negative territory. The Energy group bucked the downtrend with Chevron (CVX +2.82%) and Exxon Mobil (XOM +3.13%) both rallying as WTI crude surged 23.6% to $17.03/barrel. In earnings, railroad operator CSX (CSX +0.95%) rose after beating quarterly profit expectations. Las Vegas Sands (LVS +12.09%) rose following a positive earnings report and predictions of a quick rebound in Asia. Elsewhere, Chipmaker Xilinx (XLNX -3.83%) fell after providing weak forward guidance. In other corporate news, Target (TGT -2.74%) fell despite announcing a four-fold spike in April digital sales. The retailer cautioned that its quarterly earnings would likely be pressured by an increase in lower-margin products.
On the data front, initial jobless claims for the week ending April 18 rose by 4.4 million, however the figure slowed for the third consecutive week. Meanwhile, flash manufacturing and services PMI readings from research firm IHS Markit showed activity in both sectors deteriorated further into contractionary territory in April. Treasuries advanced, with the yield on the 10-year note dropping two basis points to 0.61%. |
 Kenneth J. Gruneisen started out as a licensed stockbroker in August 1987, a couple of months prior to the historic stock market crash that took the Dow Jones Industrial Average down -22.6% in a single day. He has published daily fact-based fundamental and technical analysis on high-ranked stocks online for two decades. Through FACTBASEDINVESTING.COM, Kenneth provides educational articles, news, market commentary, and other information regarding proven investment systems that work in good times and bad.
Comments contained in the body of this report are technical opinions only and are not necessarily those of Gruneisen Growth Corp. The material herein has been obtained from sources believed to be reliable and accurate, however, its accuracy and completeness cannot be guaranteed. Our firm, employees, and customers may effect transactions, including transactions contrary to any recommendation herein, or have positions in the securities mentioned herein or options with respect thereto. Any recommendation contained in this report may not be suitable for all investors and it is not to be deemed an offer or solicitation on our part with respect to the purchase or sale of any securities. |
|
 |
Commodity-Linked Groups Outpaced Retail and Financial Gains
Kenneth J. Gruneisen - Passed the CAN SLIM® Master's Exam
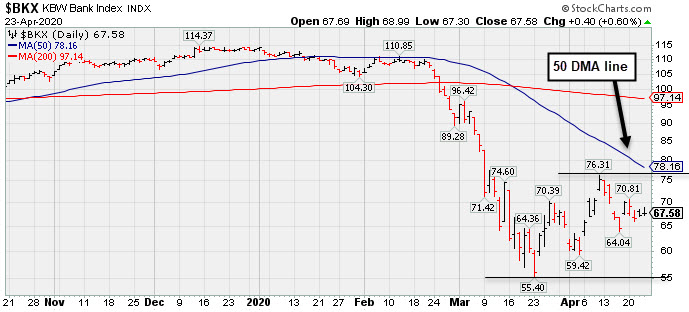
Commodity-linked groups had a positive bias as the Gold & Silver Index ($XAU +2.85%), Oil Services Index ($OSX +7.88%) and the Integrated Oil Index ($XOI +3.06%) each finished higher. The tech sector was mixed as the Semiconductor Index ($SOX -1.04%) and the Networking Index ($NWX -0.57%) lost ground and the Biotech Index ($BTK +0.50%) edged higher. The Retail Index ($XBD +0.61%) and financials had a slightly positive bias as the Bank Index ($BKX +0.60%) outpaced the Broker/Dealer Index ($XBD +0.12%). PICTURED: The Bank Index ($BKX +0.60%) is still below its 50-day moving average (DMA) line after rebounding from its March 2020 low.
| Oil Services |
$OSX |
28.65 |
+2.10 |
+7.91% |
-63.41% |
| Integrated Oil |
$XOI |
701.46 |
+20.81 |
+3.06% |
-44.79% |
| Semiconductor |
$SOX |
1,664.67 |
-17.45 |
-1.04% |
-10.00% |
| Networking |
$NWX |
502.25 |
-2.88 |
-0.57% |
-13.91% |
| Broker/Dealer |
$XBD |
223.37 |
+0.26 |
+0.12% |
-23.08% |
| Retail |
$RLX |
2,550.12 |
+15.53 |
+0.61% |
+4.12% |
| Gold & Silver |
$XAU |
115.25 |
+3.19 |
+2.85% |
+7.79% |
| Bank |
$BKX |
67.58 |
+0.40 |
+0.60% |
-40.38% |
| Biotech |
$BTK |
5,208.46 |
+25.79 |
+0.50% |
+2.78% |
|
|
|
 |
Featured Stocks
Kenneth J. Gruneisen - Passed the CAN SLIM® Master's Exam
As leadership improves the number of stocks covered in this area should be expected to increase gradually, as superior candidates are added to the Featured Stocks list on a case-by-case basis. Feel free to contact us if you have a need for any additional information. |
|
|
Color Codes Explained :
Y - Better candidates highlighted by our
staff of experts.
G - Previously featured
in past reports as yellow but may no longer be buyable under the
guidelines.
***Last / Change / Volume data in this table is the closing quote data***
|
|
|
THESE ARE NOT BUY RECOMMENDATIONS!
Comments contained in the body of this report are technical
opinions only. The material herein has been obtained
from sources believed to be reliable and accurate, however,
its accuracy and completeness cannot be guaranteed.
This site is not an investment advisor, hence it does
not endorse or recommend any securities or other investments.
Any recommendation contained in this report may not
be suitable for all investors and it is not to be deemed
an offer or solicitation on our part with respect to
the purchase or sale of any securities. All trademarks,
service marks and trade names appearing in this report
are the property of their respective owners, and are
likewise used for identification purposes only.
This report is a service available
only to active Paid Premium Members.
You may opt-out of receiving report notifications
at any time. Questions or comments may be submitted
by writing to Premium Membership Services 665 S.E. 10 Street, Suite 201 Deerfield Beach, FL 33441-5634 or by calling 1-800-965-8307
or 954-785-1121.
|
|
|