***Last / Change / Volume data in this table is the closing quote data***
Symbol/Exchange
Company Name
Industry Group |
PRICE |
CHANGE
(%Change) |
Day High |
Volume
(% DAV)
(% 50 day avg vol) |
52 Wk Hi
% From Hi |
Featured
Date |
Price
Featured |
Pivot Featured |
|
Max Buy |
MLR
-
NYSE
Miller Industries Inc
AUTOMOTIVE - Auto Parts
|
$34.21
|
+0.07
0.21% |
$34.57
|
43,995
109.99% of 50 DAV
50 DAV is 40,000
|
$35.26
-2.98%
|
11/30/2018
|
$28.35
|
PP = $29.50
|
|
MB = $30.98
|
 Most Recent Note - 4/23/2019 6:53:42 PM
G - Rebounded above its 50 DMA line ($32.54) to within close striking distance of the prior high. Below the 50 DMA line the prior low ($30.38 on 3/27/19) defines the next near-term support to watch. Reported earnings +17% on +13% sales revenues for the Dec '18 quarter, below the +25% minimum guideline (C criteria), raising fundamental concerns.
>>> FEATURED STOCK ARTICLE : Below 50-Day Average After Damaging Losses - 4/8/2019 |
View all notes |
Set NEW NOTE alert |
Company Profile |
SEC
News |
Chart |
Request a new note
C
A
S
I |
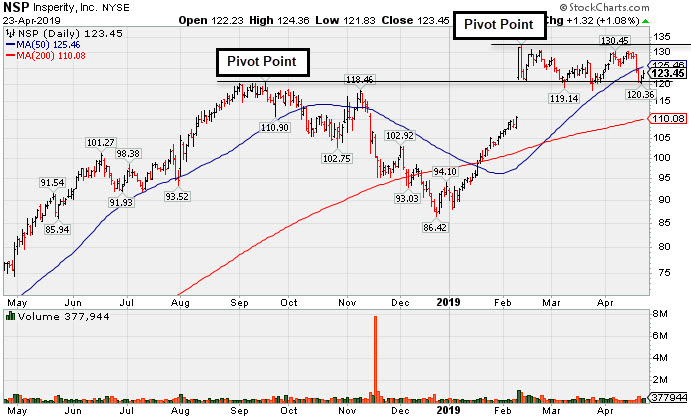
NSP
-
NYSE
Insperity Inc
Comml Svcs-Outsourcing
|
$123.45
|
+1.32
1.08% |
$124.36
|
348,977
93.31% of 50 DAV
50 DAV is 374,000
|
$132.50
-6.83%
|
4/16/2019
|
$129.59
|
PP = $132.60
|
|
MB = $139.23
|
Most Recent Note - 4/23/2019 6:49:59 PM
G - Due to report earnings news before the open on Monday, April 29, 2019. Volume and volatility often increase near earnings news. A rebound above the 50 DMA line ($125.59) is needed for its outlook to improve. A new pivot point was cited based on its 2/12/19 high plus 10 cents. Subsequent gains above the pivot point backed by at least +40% above average volume may trigger a new (or add-on) technical buy signal. Prior highs in the $118-121 area recently acted as support. See the latest FSU analysis for more details and a new annotated graph.
>>> FEATURED STOCK ARTICLE : Rebound Above 50-Day Moving Average Line Needed - 4/23/2019 |
View all notes |
Set NEW NOTE alert |
Company Profile |
SEC
News |
Chart |
Request a new note
C
A
S
I |
ZBRA
-
NASDAQ
Zebra Tech Corp Cl A
COMPUTER HARDWARE - Computer Peripherals
|
$233.44
|
+2.93
1.27% |
$233.54
|
536,807
116.70% of 50 DAV
50 DAV is 460,000
|
$235.98
-1.07%
|
2/14/2019
|
$198.10
|
PP = $184.85
|
|
MB = $194.09
|
Most Recent Note - 4/18/2019 11:05:15 AM
G - Perched at its all-time high, very extended from any sound base. Its 50 DMA line ($208) defines near-term support to watch on pullbacks.
>>> FEATURED STOCK ARTICLE : Zebra Extended From Prior Base - 3/25/2019 |
View all notes |
Set NEW NOTE alert |
Company Profile |
SEC
News |
Chart |
Request a new note
C
A
S
I |
FTNT
-
NASDAQ
Fortinet Inc
Computer Sftwr-Security
|
$91.99
|
+0.42
0.46% |
$92.13
|
1,776,552
105.75% of 50 DAV
50 DAV is 1,680,000
|
$96.96
-5.13%
|
4/10/2019
|
$89.76
|
PP = $88.70
|
|
MB = $93.14
|
Most Recent Note - 4/18/2019 10:52:19 AM
Y - Color code is changed to yellow after pulling back below its "max buy" level. Testing prior highs in the $88 area defining near-term support above its 50 DMA line ($85.34).
>>> FEATURED STOCK ARTICLE : Volume-Driven Gain Cleared Flat Base and Little Resistance Remains - 4/10/2019 |
View all notes |
Set NEW NOTE alert |
Company Profile |
SEC
News |
Chart |
Request a new note
C
A
S
I |
SPSC
-
NASDAQ
S P S Commerce Inc
COMPUTER SOFTWARE and SERVICES - Application Software
|
$101.65
|
-0.59
-0.58% |
$103.48
|
123,033
75.95% of 50 DAV
50 DAV is 162,000
|
$113.31
-10.29%
|
3/26/2019
|
$107.12
|
PP = $113.41
|
|
MB = $119.08
|
Most Recent Note - 4/17/2019 5:43:00 PM
G - Color code is changed to green after slumping below its 50 DMA line ($104.88) which recently acted as support. Damaging losses below the recent low ($100.28 on 4/08/19) would raise more serious concerns. A rebound above the 50 DMA line is needed for its outlook to improve. Subsequent gains above the pivot point backed by at least +40% above average volume may trigger a new (or add-on) technical buy signal.
>>> FEATURED STOCK ARTICLE : Consolidating in Orderly Fashion Above Prior Highs - 3/22/2019 |
View all notes |
Set NEW NOTE alert |
Company Profile |
SEC
News |
Chart |
Request a new note
C
A
S
I |
Symbol/Exchange
Company Name
Industry Group |
PRICE |
CHANGE
(%Change) |
Day High |
Volume
(% DAV)
(% 50 day avg vol) |
52 Wk Hi
% From Hi |
Featured
Date |
Price
Featured |
Pivot Featured |
|
Max Buy |
SSNC
-
NASDAQ
S S & C Technologies
COMPUTER SOFTWARE and SERVICES - Application Software
|
$66.38
|
+1.36
2.09% |
$66.72
|
1,049,597
62.14% of 50 DAV
50 DAV is 1,689,000
|
$66.30
0.12%
|
2/15/2019
|
$59.73
|
PP = $61.07
|
|
MB = $64.12
|
Most Recent Note - 4/23/2019 6:57:56 PM
G - Hit a new all-time high with today's third consecutive gain with volume below average. Its 50 DMA line ($62.14) and prior low define near term support to watch on pullbacks.
>>> FEATURED STOCK ARTICLE : Hovering Near High With Volume Totals Cooling in Recent Weeks - 3/27/2019 |
View all notes |
Set NEW NOTE alert |
Company Profile |
SEC
News |
Chart |
Request a new note
C
A
S
I |
IRBT
-
NASDAQ
Irobot Corp
CONSUMER DURABLES - Electronic Equipment
|
$130.57
|
+1.84
1.43% |
$132.30
|
1,305,953
172.06% of 50 DAV
50 DAV is 759,000
|
$132.88
-1.74%
|
4/16/2019
|
$130.56
|
PP = $132.98
|
|
MB = $139.63
|
Most Recent Note - 4/18/2019 5:27:11 PM
Y - Volume totals have been cooling in recent weeks and a new pivot point was cited based on its 3/05/19 high plus 10 cents. Subsequent gains above the pivot point backed by at least +40% above average volume may trigger a new (or add-on) technical buy signal. Its 50 DMA line ($121.77) and recent low ($114.40 on 3/27/19) define important near-term support to watch on pullbacks. See the latest FSU analysis for more details and a new annotated graph.
>>> FEATURED STOCK ARTICLE : Household Appliance Firm Quietly Hovers Near All-Time High - 4/18/2019 |
View all notes |
Set NEW NOTE alert |
Company Profile |
SEC
News |
Chart |
Request a new note
C
A
S
I |
AUDC
-
NASDAQ
Audiocodes Ltd
ELECTRONICS - Scientific and Technical Instrum
|
$16.99
|
+0.75
4.62% |
$17.10
|
423,419
220.53% of 50 DAV
50 DAV is 192,000
|
$16.36
3.88%
|
3/20/2019
|
$13.66
|
PP = $15.06
|
|
MB = $15.81
|
Most Recent Note - 4/23/2019 12:11:51 PM
G - Color code is changed to green after rising above its "max buy" level and getting extended from the prior base. Prior high ($14.96) defines initial support to watch above its 50 DMA line ($14.12).
>>> FEATURED STOCK ARTICLE : Building a Base and Found Support Near 50-Day Moving Average - 3/20/2019 |
View all notes |
Set NEW NOTE alert |
Company Profile |
SEC
News |
Chart |
Request a new note
C
A
S
I |
ENV
-
NYSE
Envestnet Inc
FINANCIAL SERVICES - Diversified Investments
|
$71.08
|
+1.00
1.43% |
$71.23
|
920,719
304.87% of 50 DAV
50 DAV is 302,000
|
$70.68
0.57%
|
3/15/2019
|
$66.05
|
PP = $64.90
|
|
MB = $68.15
|
Most Recent Note - 4/18/2019 10:57:28 AM
G - Perched near its "max buy" level and not far from its all-time high. The recent low ($63.34 on 3/27/19) and 50 DMA line ($62.94) define near-term support to watch on pullbacks.
>>> FEATURED STOCK ARTICLE : Volume Heavy Behind Rally to New Highs - 3/15/2019 |
View all notes |
Set NEW NOTE alert |
Company Profile |
SEC
News |
Chart |
Request a new note
C
A
S
I |
LHCG
-
NASDAQ
L H C Group Inc
HEALTH SERVICES - Home Health Care
|
$104.99
|
+4.78
4.77% |
$105.10
|
459,479
102.33% of 50 DAV
50 DAV is 449,000
|
$115.54
-9.13%
|
1/23/2019
|
$107.29
|
PP = $107.61
|
|
MB = $112.99
|
Most Recent Note - 4/23/2019 7:00:51 PM
G - Found prompt support at its 200 DMA line ($99.33) and posted a volume-driven gain today. Disciplined investors always limit losses by selling any stock that falls more than -7% from their purchase price. A rebound above the 50 DMA line ($108.79) is needed for its outlook to improve.
>>> FEATURED STOCK ARTICLE : Sputtering Near 50-Day Moving Average Line - 4/1/2019 |
View all notes |
Set NEW NOTE alert |
Company Profile |
SEC
News |
Chart |
Request a new note
C
A
S
I |
Symbol/Exchange
Company Name
Industry Group |
PRICE |
CHANGE
(%Change) |
Day High |
Volume
(% DAV)
(% 50 day avg vol) |
52 Wk Hi
% From Hi |
Featured
Date |
Price
Featured |
Pivot Featured |
|
Max Buy |
ENSG
-
NASDAQ
Ensign Group Inc
HEALTH SERVICES - Long-Term Care Facilities
|
$50.26
|
+1.55
3.18% |
$50.89
|
204,207
66.09% of 50 DAV
50 DAV is 309,000
|
$54.56
-7.88%
|
2/7/2019
|
$48.71
|
PP = $49.06
|
|
MB = $51.51
|
Most Recent Note - 4/23/2019 7:04:19 PM
G - Rebounded near its 50 DMA line ($50.44) with light volume behind today's 3rd consecutive gain. That important short-term average may act as resistance. A convincing rebound above the 50 DMA line would help its outlook improve.
>>> FEATURED STOCK ARTICLE : Two Damaging Losses Hurt Outlook - 4/17/2019 |
View all notes |
Set NEW NOTE alert |
Company Profile |
SEC
News |
Chart |
Request a new note
C
A
S
I |
LULU
-
NASDAQ
Lululemon Athletica
MANUFACTURING - Textile Manufacturing
|
$176.78
|
+3.76
2.17% |
$177.16
|
2,337,557
101.77% of 50 DAV
50 DAV is 2,297,000
|
$174.64
1.23%
|
3/28/2019
|
$169.20
|
PP = $164.89
|
|
MB = $173.13
|
Most Recent Note - 4/22/2019 5:42:44 PM
Y - Quietly perched near its all-time high and the previously noted "max buy" level. Stubbornly holding its ground since a "breakaway gap" on 3/28/19 triggered a technical buy signal. Prior highs define initial support to watch above its 50 DMA line ($155).
>>> FEATURED STOCK ARTICLE : Breakway Gap Backed by More Than 6 Times Average Volume - 3/28/2019 |
View all notes |
Set NEW NOTE alert |
Company Profile |
SEC
News |
Chart |
Request a new note
C
A
S
I |
NXST
-
NASDAQ
Nexstar Media Group Cl A
MEDIA - Broadcasting - TV
|
$115.45
|
+1.65
1.45% |
$115.89
|
344,171
60.38% of 50 DAV
50 DAV is 570,000
|
$119.93
-3.74%
|
2/26/2019
|
$94.26
|
PP = $89.76
|
|
MB = $94.25
|
Most Recent Note - 4/18/2019 11:01:36 AM
G - Perched at its all-time high, very extended from any sound base. Disciplined investors avoid chasing stocks more than +5% above the prior high. Its 50 DMA line ($103) defines near-term support to watch on pullbacks.
>>> FEATURED STOCK ARTICLE : Hitting New High and Very Extended From Prior Base - 4/4/2019 |
View all notes |
Set NEW NOTE alert |
Company Profile |
SEC
News |
Chart |
Request a new note
C
A
S
I |
ULTA
-
NASDAQ
Ulta Beauty Inc
SPECIALTY RETAIL - Specialty Retail, Other
|
$351.63
|
+4.22
1.21% |
$355.86
|
556,491
71.62% of 50 DAV
50 DAV is 777,000
|
$359.69
-2.24%
|
3/15/2019
|
$341.27
|
PP = $322.59
|
|
MB = $338.72
|
Most Recent Note - 4/18/2019 11:04:23 AM
G - Volume totals have been light while stubbornly holding its ground near its all-time high. Its 50 DMA line ($327) defines near term support above prior highs.
>>> FEATURED STOCK ARTICLE : Consolidating Following Big "Breakaway Gap" - 3/19/2019 |
View all notes |
Set NEW NOTE alert |
Company Profile |
SEC
News |
Chart |
Request a new note
C
A
S
I |
UBNT
-
NASDAQ
Ubiquiti Networks
TELECOMMUNICATIONS - Diversified Communication Serv
|
$170.52
|
+0.30
0.18% |
$174.95
|
386,784
96.45% of 50 DAV
50 DAV is 401,000
|
$172.80
-1.32%
|
2/8/2019
|
$121.97
|
PP = $115.54
|
|
MB = $121.32
|
Most Recent Note - 4/17/2019 5:39:55 PM
G - Reversed into the red for a loss today on higher volume after hitting another new all-time high, breaking a streak of 5 consecutive gains backed by average of lighter volume. Extended from any sound base after a big rally. Its prior high ($148.68 on 2/27/19) and its 50 DMA line ($145.87) define near-term support to watch. Fundamentals remain strong.
>>> FEATURED STOCK ARTICLE : Extended From Any Sound Bass and Wedging to New Highs - 4/12/2019 |
View all notes |
Set NEW NOTE alert |
Company Profile |
SEC
News |
Chart |
Request a new note
C
A
S
I |
Symbol/Exchange
Company Name
Industry Group |
PRICE |
CHANGE
(%Change) |
Day High |
Volume
(% DAV)
(% 50 day avg vol) |
52 Wk Hi
% From Hi |
Featured
Date |
Price
Featured |
Pivot Featured |
|
Max Buy |
ESNT
-
NYSE
Essent Group Ltd
Finance-MrtgandRel Svc
|
$46.27
|
+0.74
1.63% |
$46.86
|
414,566
65.08% of 50 DAV
50 DAV is 637,000
|
$47.94
-3.48%
|
3/18/2019
|
$45.84
|
PP = $45.06
|
|
MB = $47.31
|
Most Recent Note - 4/23/2019 6:51:46 PM
Y - Posted 2 consecutive gains with light volume. Found support above its 50 DMA line ($44.32) reassuringly on the recent pullback. Still faces some resistance due to overhead supply up to the $50 level. Fundamentals are strong.
>>> FEATURED STOCK ARTICLE : Big Breakout Gain With +350% Above Average Volume - 3/18/2019 |
View all notes |
Set NEW NOTE alert |
Company Profile |
SEC
News |
Chart |
Request a new note
C
A
S
I |
FIVE
-
NASDAQ
Five Below Inc
Retail-DiscountandVariety
|
$143.53
|
+1.73
1.22% |
$144.01
|
996,368
92.69% of 50 DAV
50 DAV is 1,075,000
|
$142.81
0.50%
|
4/11/2019
|
$132.05
|
PP = $133.75
|
|
MB = $140.44
|
Most Recent Note - 4/17/2019 5:47:13 PM
Y - Hit yet another new all-time high approaching its "max buy" level with today's 6th consecutive gain, however, the recent gains have lacked great volume conviction. Gains above the pivot point must have at least +40% above average volume to clinch a proper technical buy signal.
>>> FEATURED STOCK ARTICLE : Finished Strong After Featured Again in Mid-Day Report - 4/11/2019 |
View all notes |
Set NEW NOTE alert |
Company Profile |
SEC
News |
Chart |
Request a new note
C
A
S
I |
PANW
-
NYSE
Palo Alto Networks
Computer Sftwr-Security
|
$241.09
|
+1.81
0.76% |
$242.20
|
1,500,701
110.43% of 50 DAV
50 DAV is 1,359,000
|
$260.63
-7.50%
|
2/25/2019
|
$233.54
|
PP = $239.60
|
|
MB = $251.58
|
Most Recent Note - 4/22/2019 5:58:37 PM
Y - Posted a gain today with lighter volume, finding support near its 50 DMA line ($238.21) and the prior low ($233.15 on 4/04/19). Fundamentals remain strong.
>>> FEATURED STOCK ARTICLE : Consolidating Above Prior High and 50-Day Average - 4/3/2019 |
View all notes |
Set NEW NOTE alert |
Company Profile |
SEC
News |
Chart |
Request a new note
C
A
S
I |
ANET
-
NYSE
Arista Networks Inc
TELECOMMUNICATIONS - Communication Equipment
|
$321.06
|
-6.54
-2.00% |
$326.01
|
1,073,413
121.56% of 50 DAV
50 DAV is 883,000
|
$331.27
-3.08%
|
3/13/2019
|
$295.38
|
PP = $313.37
|
|
MB = $329.04
|
Most Recent Note - 4/22/2019 5:40:04 PM
Y - Hovering near its all-time high with volume totals cooling. It remains below the "max buy" level previously noted. See the latest FSU analysis for more details and a new annotated graph.
>>> FEATURED STOCK ARTICLE : Hovering Near High With Volume Totals Cooling - 4/22/2019 |
View all notes |
Set NEW NOTE alert |
Company Profile |
SEC
News |
Chart |
Request a new note
C
A
S
I |
PAYC
-
NYSE
Paycom Software Inc
COMPUTER SOFTWARE and SERVICES - Application Software
|
$194.62
|
+4.43
2.33% |
$195.82
|
695,815
119.15% of 50 DAV
50 DAV is 584,000
|
$193.75
0.45%
|
2/6/2019
|
$171.66
|
PP = $164.18
|
|
MB = $172.39
|
Most Recent Note - 4/23/2019 6:56:25 PM
G - Hit a new high with today's 3rd consecutive gain. Did not form a sound new base of sufficient length. Held its ground at its 50 DMA line ($183.22) which defines important near-term support to watch above prior lows.
>>> FEATURED STOCK ARTICLE : Paycom Software Quietly Hovering Near All-Time High - 4/16/2019 |
View all notes |
Set NEW NOTE alert |
Company Profile |
SEC
News |
Chart |
Request a new note
C
A
S
I |
Symbol/Exchange
Company Name
Industry Group |
PRICE |
CHANGE
(%Change) |
Day High |
Volume
(% DAV)
(% 50 day avg vol) |
52 Wk Hi
% From Hi |
Featured
Date |
Price
Featured |
Pivot Featured |
|
Max Buy |
PYPL
-
NASDAQ
Paypal Holdings Inc
Finance-CrdtCard/PmtPr
|
$106.90
|
+0.09
0.08% |
$107.51
|
8,499,653
130.56% of 50 DAV
50 DAV is 6,510,000
|
$109.00
-1.93%
|
1/24/2019
|
$92.56
|
PP = $93.80
|
|
MB = $98.49
|
Most Recent Note - 4/18/2019 12:50:56 PM
G - Pulling back from its all-time high with today's loss on higher volume. Very extended from any sound base after gains lacking great volume conviction in recent weeks. Well above its 50 DMA line ($100.32) which defines support to watch.
>>> FEATURED STOCK ARTICLE : Extended From Base After Gains in Recent Weeks Lacking Volume - 4/2/2019 |
View all notes |
Set NEW NOTE alert |
Company Profile |
SEC
News |
Chart |
Request a new note
C
A
S
I |
ALRM
-
NASDAQ
Alarm.com Holdings Inc
Security/Sfty
|
$69.86
|
+1.08
1.57% |
$70.61
|
263,416
59.33% of 50 DAV
50 DAV is 444,000
|
$69.61
0.36%
|
1/22/2019
|
$60.52
|
PP = $60.30
|
|
MB = $63.32
|
Most Recent Note - 4/22/2019 5:50:00 PM
G - Posted a gain today with light volume. Recently wedging to new highs with gains lacking great volume conviction. Found prompt support near the 50 DMA line after it reported earnings +12% on +25% sales revenues for the Dec '18 quarter, below the +25% minimum earnings guideline (C criteria), raising fundamental concerns.
>>> FEATURED STOCK ARTICLE : Consolidating Near 50-Day Average Following Sub Par Report - 3/29/2019 |
View all notes |
Set NEW NOTE alert |
Company Profile |
SEC
News |
Chart |
Request a new note
C
A
S
I |
PLNT
-
NYSE
Planet Fitness Inc Cl A
Leisure-Services
|
$73.11
|
-0.64
-0.87% |
$74.29
|
1,095,674
79.40% of 50 DAV
50 DAV is 1,380,000
|
$74.60
-2.00%
|
11/7/2018
|
$57.10
|
PP = $55.45
|
|
MB = $58.22
|
Most Recent Note - 4/18/2019 11:02:36 AM
G - Holding its ground near its all-time high, very extended from any sound base. Its 50 DMA line (65.22) defines near-term support above prior highs in the $59-60 area. Fundamentals remain strong.
>>> FEATURED STOCK ARTICLE : Perched Near High Very Extended From Prior Base - 4/5/2019 |
View all notes |
Set NEW NOTE alert |
Company Profile |
SEC
News |
Chart |
Request a new note
C
A
S
I |
TEAM
-
NASDAQ
Atlassian Corp Plc Cl A
Comp Sftwr-Spec Enterprs
|
$106.72
|
+2.97
2.86% |
$107.10
|
3,115,225
192.18% of 50 DAV
50 DAV is 1,621,000
|
$117.06
-8.83%
|
4/16/2019
|
$114.77
|
PP = $116.80
|
|
MB = $122.64
|
Most Recent Note - 4/23/2019 1:22:09 PM
G - Rebounding after a damaging gap down and volume-driven loss on 4/18/19 violated its 50 DMA line triggering a technical sell signal. That short-term average may act as resistance, but a rebound above the 50 DMA line ($108.84) is needed for its outlook to improve. Reported earnings +133% on +38% sales revenues for the Mar '19 quarter, continuing its strong earnings track record.
>>> FEATURED STOCK ARTICLE : Perched Near High Enduring Distributional Pressure - 4/9/2019 |
View all notes |
Set NEW NOTE alert |
Company Profile |
SEC
News |
Chart |
Request a new note
C
A
S
I |
GLOB
-
NYSE
Globant SA
Computer-Tech Services
|
$83.65
|
+3.56
4.44% |
$83.75
|
276,421
136.84% of 50 DAV
50 DAV is 202,000
|
$82.93
0.86%
|
2/15/2019
|
$69.35
|
PP = $70.00
|
|
MB = $73.50
|
Most Recent Note - 4/23/2019 7:02:13 PM
G - Posted a big gain today with above average volume for a new all-time high, getting more extended from any sound base. Near-term support is at its prior high ($74) and its 50 DMA line ($72.52). Violations would raise concerns and trigger technical sell signals.
>>> FEATURED STOCK ARTICLE : Consolidating Near 50-Day Average Quietly Perched Near High - 3/26/2019 |
View all notes |
Set NEW NOTE alert |
Company Profile |
SEC
News |
Chart |
Request a new note
C
A
S
I |
Symbol/Exchange
Company Name
Industry Group |
PRICE |
CHANGE
(%Change) |
Day High |
Volume
(% DAV)
(% 50 day avg vol) |
52 Wk Hi
% From Hi |
Featured
Date |
Price
Featured |
Pivot Featured |
|
Max Buy |
TTD
-
NASDAQ
The Trade Desk Inc Cl A
Comml Svcs-Advertising
|
$210.73
|
-0.30
-0.14% |
$215.00
|
980,835
60.73% of 50 DAV
50 DAV is 1,615,000
|
$214.70
-1.85%
|
4/22/2019
|
$211.03
|
PP = $214.80
|
|
MB = $225.54
|
Most Recent Note - 4/22/2019 5:48:08 PM
Y - Posted a big gain today with near average volume for its second-best close ever. Color code is changed to yellow with new pivot point cited based on its 3/22/19 high plus 10 cents. Subsequent gains above the pivot point backed by at least +40% above average volume may trigger a new (or add-on) technical buy signal. Consolidated in an orderly fashion above its 50 DMA line ($190) which defines initial support to watch above the prior low ($178.30 on 3/27/19).
>>> FEATURED STOCK ARTICLE : Hit Another New All-Time High Getting Extended From Prior Base - 3/21/2019 |
View all notes |
Set NEW NOTE alert |
Company Profile |
SEC
News |
Chart |
Request a new note
C
A
S
I |