You are not logged in.
This means you
CAN ONLY VIEW reports that were published prior to Saturday, February 24, 2024.
You
MUST UPGRADE YOUR MEMBERSHIP if you want to see any current reports.
AFTER MARKET UPDATE - WEDNESDAY, APRIL 22ND, 2020
Previous After Market Report Next After Market Report >>>
|
|
|
|
DOW |
+456.94 |
23,475.82 |
+1.99% |
|
Volume |
1,022,051,068 |
-1% |
|
Volume |
3,016,256,500 |
-20% |
|
NASDAQ |
+232.15 |
8,495.38 |
+2.81% |
|
Advancers |
2,051 |
71% |
|
Advancers |
2,162 |
67% |
|
S&P 500 |
+62.75 |
2,799.31 |
+2.29% |
|
Decliners |
854 |
29% |
|
Decliners |
1,060 |
33% |
|
Russell 2000 |
+16.43 |
1,201.52 |
+1.39% |
|
52 Wk Highs |
16 |
|
|
52 Wk Highs |
30 |
|
|
S&P 600 |
+6.08 |
698.74 |
+0.88% |
|
52 Wk Lows |
22 |
|
|
52 Wk Lows |
16 |
|
|
 |
Breadth Positive as Major Indices Rose With Tech Leadership
Kenneth J. Gruneisen - Passed the CAN SLIM® Master's Exam
The Dow advanced 456 points, while the S&P 500 gained 2.3%. The Nasdaq Composite was up 2.8%. Breadth was positive as advancers led decliners by near a 5-2 margin on the NYSE and by 2-1 on the Nasdaq exchange. The reported volume totals were lighter than the prior session on the NYSE and on the Nasdaq exchange, indicating less institutional buying conviction. There were 18 high-ranked companies from the Leaders List hit new 52-week highs and were listed on the BreakOuts Page, versus 6 on the prior session. New 52-week lows outnumbered the new 52-week highs on the NYSE while new highs outnumbered new lows on the Nasdaq exchange. The follow-through day of big confirming gains on Monday, April 6th from the major indices on higher volume, coupled with an increase in the number of stocks hitting new highs, signaled a valid new market uptrend (M criteria). Any sustainable rally requires a healthy crop of new leaders, so it is important to see continued improvement in this area. Charts used courtesy of www.stockcharts.com
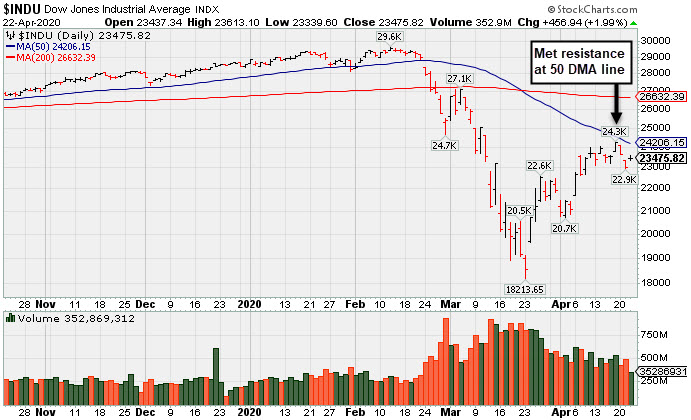
PICTURED: The Dow Jones Industrial Average met resistance at its 50-day moving average (DMA) line.
Stocks finished higher on Wednesday, as investors digest corporate earnings results and a rebound in oil prices. Sentiment was also lifted on reports that Congress remains on track to pass additional COVID-19 legislation worth $484 billion, which would provide further assistance to small businesses and funding for hospitals and testing.
WTI crude climbed more than 20% to $13.97/barrel, partly boosted by escalating U.S.-Iranian tensions. However, oversupply concerns lingered as U.S. crude stockpiles increased by more than 10 million barrels for the fourth-consecutive week.
All 11 S&P 500 sectors closed in positive territory with Technology shares pacing gains. In earnings, Netflix (NFLX -2.86%) fell despite reporting a record 15.8 million increase in first-quarter subscribers, as the streaming giant warned the growth may not persist as lockdowns ease. Delta Airlines (DAL -2.77%) despite posting a smaller-than-expected quarterly loss. In Consumer Staples, Kimberly-Clark (KMB +2.47%) following an 11% jump in organic sales. Elsewhere, Chipotle Mexican Grill (CMG +14.00%) rose after delivering an 80% spike in digital sales. In the semiconductor space, Texas Instruments (TXN +4.81%) on the heels of a top and bottom line beat. Meanwhile, Snap (SNAP +36.7%) on a surge in engagement levels, while AT&T (T -1.44%) fell after pulling its full-year guidance amid COVID-19 uncertainty.
On the data front, a release from the FHFA revealed home prices rose 0.7% in February, accelerating from January’s 0.3% advance. Treasuries declined, with the yield on the 10-year note up six basis points to 0.62%. |
 Kenneth J. Gruneisen started out as a licensed stockbroker in August 1987, a couple of months prior to the historic stock market crash that took the Dow Jones Industrial Average down -22.6% in a single day. He has published daily fact-based fundamental and technical analysis on high-ranked stocks online for two decades. Through FACTBASEDINVESTING.COM, Kenneth provides educational articles, news, market commentary, and other information regarding proven investment systems that work in good times and bad.
Comments contained in the body of this report are technical opinions only and are not necessarily those of Gruneisen Growth Corp. The material herein has been obtained from sources believed to be reliable and accurate, however, its accuracy and completeness cannot be guaranteed. Our firm, employees, and customers may effect transactions, including transactions contrary to any recommendation herein, or have positions in the securities mentioned herein or options with respect thereto. Any recommendation contained in this report may not be suitable for all investors and it is not to be deemed an offer or solicitation on our part with respect to the purchase or sale of any securities. |
|
 |
Commodity, Tech, Retail and Financial Indexes Rose
Kenneth J. Gruneisen - Passed the CAN SLIM® Master's Exam
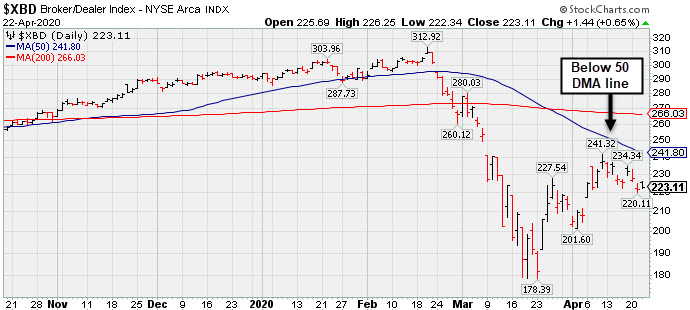
The tech sector had a clearly positive bias as the Semiconductor Index ($SOX +5.88%) outpaced the Networking Index ($NWX +3.54%) and the Biotech Index ($BTK +0.79%). The financials had a slightly positive bias as the Bank Index ($BKX +0.93%) and the Broker/Dealer Index ($XBD +0.65%) edged higher. Commodity-linked groups were solidly higher as the Gold & Silver Index ($XAU +6.43%), Oil Services Index ($OSX +2.93%) and the Integrated Oil Index ($XOI +4.80%) each ratcheted higher. PICTURED: The Broker/Dealer Index ($XBD +0.65%) is still below its 50-day moving average (DMA) line after rebounding from its March 2020 low.
| Oil Services |
$OSX |
26.55 |
+0.75 |
+2.91% |
-66.09% |
| Integrated Oil |
$XOI |
680.65 |
+31.17 |
+4.80% |
-46.43% |
| Semiconductor |
$SOX |
1,682.12 |
+93.42 |
+5.88% |
-9.06% |
| Networking |
$NWX |
505.13 |
+17.25 |
+3.54% |
-13.42% |
| Broker/Dealer |
$XBD |
223.11 |
+1.44 |
+0.65% |
-23.17% |
| Retail |
$RLX |
2,534.59 |
+36.16 |
+1.45% |
+3.48% |
| Gold & Silver |
$XAU |
112.06 |
+6.77 |
+6.43% |
+4.81% |
| Bank |
$BKX |
67.18 |
+0.62 |
+0.93% |
-40.74% |
| Biotech |
$BTK |
5,182.67 |
+40.77 |
+0.79% |
+2.27% |
|
|
|
 |
Featured Stocks
Kenneth J. Gruneisen - Passed the CAN SLIM® Master's Exam
As leadership improves the number of stocks covered in this area should be expected to increase gradually, as superior candidates are added to the Featured Stocks list on a case-by-case basis. Feel free to contact us if you have a need for any additional information. |
|
|
Color Codes Explained :
Y - Better candidates highlighted by our
staff of experts.
G - Previously featured
in past reports as yellow but may no longer be buyable under the
guidelines.
***Last / Change / Volume data in this table is the closing quote data***
|
|
|
THESE ARE NOT BUY RECOMMENDATIONS!
Comments contained in the body of this report are technical
opinions only. The material herein has been obtained
from sources believed to be reliable and accurate, however,
its accuracy and completeness cannot be guaranteed.
This site is not an investment advisor, hence it does
not endorse or recommend any securities or other investments.
Any recommendation contained in this report may not
be suitable for all investors and it is not to be deemed
an offer or solicitation on our part with respect to
the purchase or sale of any securities. All trademarks,
service marks and trade names appearing in this report
are the property of their respective owners, and are
likewise used for identification purposes only.
This report is a service available
only to active Paid Premium Members.
You may opt-out of receiving report notifications
at any time. Questions or comments may be submitted
by writing to Premium Membership Services 665 S.E. 10 Street, Suite 201 Deerfield Beach, FL 33441-5634 or by calling 1-800-965-8307
or 954-785-1121.
|
|
|