You are not logged in.
This means you
CAN ONLY VIEW reports that were published prior to Friday, February 23, 2024.
You
MUST UPGRADE YOUR MEMBERSHIP if you want to see any current reports.
AFTER MARKET UPDATE - TUESDAY, APRIL 21ST, 2020
Previous After Market Report Next After Market Report >>>
|
|
|
|
DOW |
-631.56 |
23,018.88 |
-2.67% |
|
Volume |
1,032,574,569 |
-5% |
|
Volume |
3,750,694,400 |
-0% |
|
NASDAQ |
-297.50 |
8,263.23 |
-3.48% |
|
Advancers |
588 |
21% |
|
Advancers |
817 |
25% |
|
S&P 500 |
-86.60 |
2,736.56 |
-3.07% |
|
Decliners |
2,275 |
79% |
|
Decliners |
2,406 |
75% |
|
Russell 2000 |
-28.25 |
1,185.09 |
-2.33% |
|
52 Wk Highs |
8 |
|
|
52 Wk Highs |
24 |
|
|
S&P 600 |
-15.46 |
692.66 |
-2.18% |
|
52 Wk Lows |
31 |
|
|
52 Wk Lows |
41 |
|
|
 |
Breadth Negative as Major Indices Slump Amid Oil Collapse
Kenneth J. Gruneisen - Passed the CAN SLIM® Master's Exam
The Dow shed 631 points, bringing its two-day loss to more than 1,200 points. The S&P 500 slid 3.1%, while the Nasdaq Composite fell 3.5%. Breadth was negative as decliners led advancers by near a 4-1 margin on the NYSE and by 3-1 on the Nasdaq exchange. The reported volume totals were lighter than the prior session on the NYSE and near the prior session total on the Nasdaq exchange. Leadership waned as there were only 6 high-ranked companies from the Leaders List hit new 52-week highs and were listed on the BreakOuts Page, versus 17 on the prior session. New 52-week lows outnumbered the new 52-week highs on the NYSE and on the Nasdaq exchange. The follow-through day of big confirming gains on Monday, April 6th from the major indices on higher volume, coupled with an increase in the number of stocks hitting new highs, signaled a valid new market uptrend (M criteria). Any sustainable rally requires a healthy crop of new leaders, so it is important to see continued improvement in this area. Charts used courtesy of www.stockcharts.com
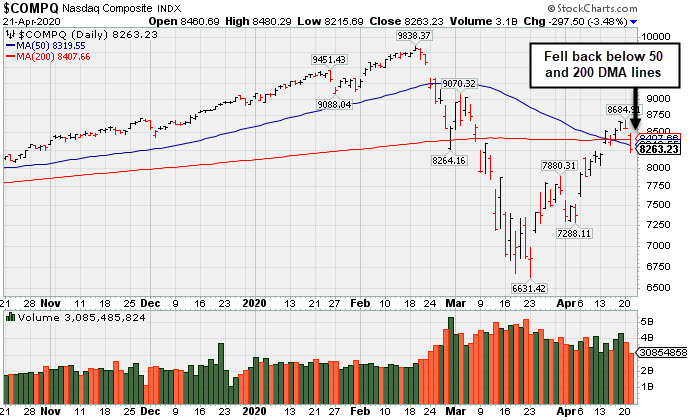
PICTURED: The Nasdaq Composite Index retreated back below its 50-day and 200-day moving average (DMA) lines.
Stocks experienced their worst day in nearly three weeks on Tuesday as investors grappled with an unprecedented sell-off in oil markets and digested downbeat corporate earnings results.
The most actively traded June WTI crude futures contract fell 36.1% to $13.05/barrel, while the May contract expiring today rebounded to $10.01/barrel on light volume a day after slumping into negative territory on Monday. The coronavirus outbreak has ravaged the near-term demand outlook for oil, causing producers to face a shortage in storage capacity. Meanwhile, news that the White House and Congressional leaders reached an agreement for a fourth COVID-19 fiscal stimulus bill totaling $470 billion failed to lift investor sentiment. Amid the perceived risk-off mood, Treasuries strengthened along the curve. The yield on the benchmark 10-year note fell five basis points to 0.56%. On the data front, existing home sales fell 8.5% in March, slightly better than anticipated.
All 11 S&P 500 sectors ended lower, with Technology shares leading laggards with a 4.1% decline. In earnings, IBM (IBM -2.92%) fell after its revenue missed consensus estimates and the Tech stalwart withdrew its full-year guidance amid coronavirus uncertainties. Coca-Cola (KO -2.58%) after warning that weak demand for soft drinks would hurt its current-quarter results. Also in the Consumer Staples space, Philip Morris (PM 5.96%) following its downbeat full-year guidance. Elsewhere, Travelers Companies (TRV +0,09) finished little changed after announcing a dividend increase despite posting a 25% drop in profit. |
 Kenneth J. Gruneisen started out as a licensed stockbroker in August 1987, a couple of months prior to the historic stock market crash that took the Dow Jones Industrial Average down -22.6% in a single day. He has published daily fact-based fundamental and technical analysis on high-ranked stocks online for two decades. Through FACTBASEDINVESTING.COM, Kenneth provides educational articles, news, market commentary, and other information regarding proven investment systems that work in good times and bad.
Comments contained in the body of this report are technical opinions only and are not necessarily those of Gruneisen Growth Corp. The material herein has been obtained from sources believed to be reliable and accurate, however, its accuracy and completeness cannot be guaranteed. Our firm, employees, and customers may effect transactions, including transactions contrary to any recommendation herein, or have positions in the securities mentioned herein or options with respect thereto. Any recommendation contained in this report may not be suitable for all investors and it is not to be deemed an offer or solicitation on our part with respect to the purchase or sale of any securities. |
|
 |
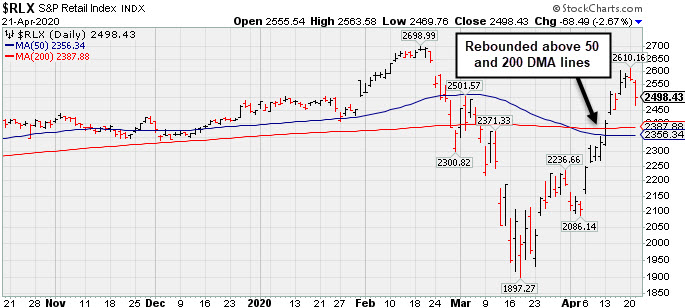
Commodity, Tech, Financial, and Retail Indexes Fell
Kenneth J. Gruneisen - Passed the CAN SLIM® Master's Exam
The tech sector had a clearly negative bias as the Biotech Index ($BTK -2.82%), Networking Index ($NWX -4.41%), and the Semiconductor Index ($SOX -4.73%) fell. The financials slumped again as the Bank Index ($BKX -3.75%) and the Broker/Dealer Index ($XBD -2.60%) fell. Commodity-linked groups rounded out the widely negative session as the Gold & Silver Index ($XAU -1.04%), Oil Services Index ($OSX -2.35%) and the Integrated Oil Index ($XOI -2.09%) each lost ground. PICTURED: The Retail Index ($RLX -2.67%) suffered a loss. It recently rebounded above its 50-day and 200-day moving average (DMA) lines from its March 2020 low.
| Oil Services |
$OSX |
25.80 |
-0.62 |
-2.35% |
-67.05% |
| Integrated Oil |
$XOI |
649.48 |
-13.87 |
-2.09% |
-48.88% |
| Semiconductor |
$SOX |
1,588.70 |
-78.87 |
-4.73% |
-14.11% |
| Networking |
$NWX |
487.87 |
-22.48 |
-4.41% |
-16.38% |
| Broker/Dealer |
$XBD |
221.67 |
-5.91 |
-2.60% |
-23.66% |
| Retail |
$RLX |
2,498.43 |
-68.49 |
-2.67% |
+2.01% |
| Gold & Silver |
$XAU |
105.29 |
-1.10 |
-1.03% |
-1.52% |
| Bank |
$BKX |
66.56 |
-2.59 |
-3.75% |
-41.28% |
| Biotech |
$BTK |
5,141.90 |
-149.17 |
-2.82% |
+1.47% |
|
|
|
 |
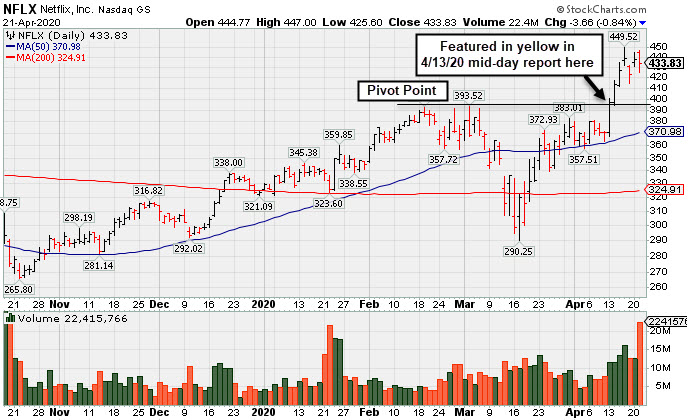
Netflix Reported Another Strong Quarter After Rally From Base
Kenneth J. Gruneisen - Passed the CAN SLIM® Master's Exam
Netflix Inc (NFLX -$3.66 or -0.84% to $433.83) reported after the close today that earnings rose +107% on +28% sales revenues for the Mar '20 quarter versus the year ago period, its 3rd consecutive very strong quarter. Volume and volatility often increase near earnings news. NFLX finished strong after it was highlighted in yellow with pivot point cited based on its 3/03/20 high plus 10 cents in the 4/13/20 mid-day report (read here). The gain above the pivot point was backed by +55% above average volume and triggered a technical buy signal. Disciplined investors avoid chasing stocks more than +5% above the prior high or pivot point. NFLX was last shown in this FSU section on 4/13/20 with an annotated graph under the headline, "Volume-Driven Breakout for Netflix". It was repeatedly noted as "extended from the previously noted base", after a spurt of volume-driven gains in the interim pushed it to new all-time highs. A previously noted downturn in FY '15 earnings (A criteria) has been followed by very strong growth. The number of top-rated funds owning its shares (I criteria) rose from 1,534 in Mar '17 to 2,277 in Dec '19, a reassuring sign concerning the I criteria. The company has 421.3 million shares in the public float (S criteria) which can make it a less likely sprinter. It has a Timeliness rating of A, a Sponsorship rating of B, and an Accumulation/Distribution Rating of A. Charts courtesy of www.stockcharts.com
 |
|
|
Color Codes Explained :
Y - Better candidates highlighted by our
staff of experts.
G - Previously featured
in past reports as yellow but may no longer be buyable under the
guidelines.
***Last / Change / Volume data in this table is the closing quote data***
|
|
|
THESE ARE NOT BUY RECOMMENDATIONS!
Comments contained in the body of this report are technical
opinions only. The material herein has been obtained
from sources believed to be reliable and accurate, however,
its accuracy and completeness cannot be guaranteed.
This site is not an investment advisor, hence it does
not endorse or recommend any securities or other investments.
Any recommendation contained in this report may not
be suitable for all investors and it is not to be deemed
an offer or solicitation on our part with respect to
the purchase or sale of any securities. All trademarks,
service marks and trade names appearing in this report
are the property of their respective owners, and are
likewise used for identification purposes only.
This report is a service available
only to active Paid Premium Members.
You may opt-out of receiving report notifications
at any time. Questions or comments may be submitted
by writing to Premium Membership Services 665 S.E. 10 Street, Suite 201 Deerfield Beach, FL 33441-5634 or by calling 1-800-965-8307
or 954-785-1121.
|
|
|