You are not logged in.
This means you
CAN ONLY VIEW reports that were published prior to Sunday, February 25, 2024.
You
MUST UPGRADE YOUR MEMBERSHIP if you want to see any current reports.
AFTER MARKET UPDATE - WEDNESDAY, APRIL 20TH, 2022
Previous After Market Report Next After Market Report >>>
|
|
|
|
DOW |
+249.59 |
35,160.79 |
+0.71% |
|
Volume |
851,837,867 |
-1% |
|
Volume |
4,550,512,300 |
+1% |
|
NASDAQ |
-166.59 |
13,453.07 |
-1.22% |
|
Advancers |
2,063 |
64% |
|
Advancers |
2,278 |
51% |
|
S&P 500 |
-2.76 |
4,459.45 |
-0.06% |
|
Decliners |
1,150 |
36% |
|
Decliners |
2,194 |
49% |
|
Russell 2000 |
+7.42 |
2,038.19 |
+0.37% |
|
52 Wk Highs |
172 |
|
|
52 Wk Highs |
108 |
|
|
S&P 600 |
+9.30 |
1,313.10 |
+0.71% |
|
52 Wk Lows |
97 |
|
|
52 Wk Lows |
206 |
|
|
 |
Major Indices Were Mixed as Investors Reacted to Earnings Reports
Kenneth J. Gruneisen - Passed the CAN SLIM® Master's Exam
The Dow jumped 249 points, while the S&P 500 slipped 0.1%. The Nasdaq Composite lost 1.2%. Volume totals reported were mixed, slightly lower than the prior session on the NYSE and slightly higher on the Nasdaq exchange. Breadth was positive as advancers led decliners by almost a 2-1 margin on the NYSE, but the mix was nearly even on the Nasdaq exchange. There were 69 high-ranked companies from the Leaders List that hit new 52-week highs and were listed on the BreakOuts Page, versus 39 on the prior session. New 52-week highs expanded and outnumbered new 52-week lows on the NYSE, however, new lows still outnumbered new highs on the Nasdaq exchange. The major indices are in an uptrend that has come under pressure (M criteria). Strict followers of the fact-based investment system only buy stocks fitting all key fundamental and technical investment criteria.
Chart courtesy of www.stockcharts.com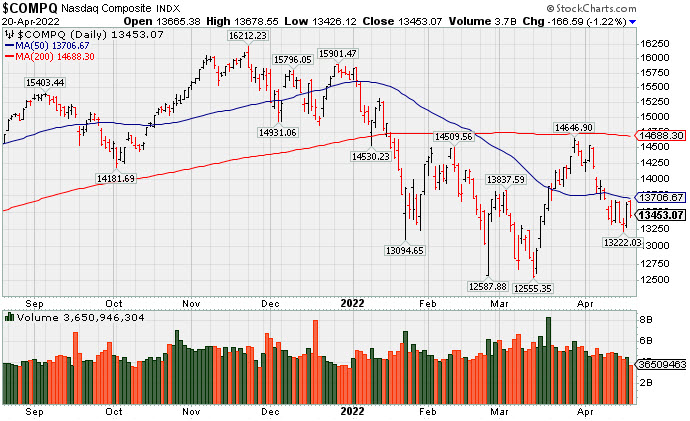 PICTURED: The Nasdaq Composite Index has been sputtering below its 50-day and 200-day moving average (DMA) lines.
U.S. stocks finished mixed on Wednesday as investors assessed key corporate earnings reports. There was a big gap down and considerable slump in Netflix Inc. (NFLX -35.12%) after the streaming giant unexpectedly posted its first loss in subscribers in a decade and became the subject of multiple analyst downgrades as the company projected another sizable decline of its user base for the current quarter. In other earnings, International Business Machines Corp. (IBM +7.10%) rose after topping consensus profit and revenue estimates amid strength in its hybrid-cloud offerings. Elsewhere, Procter & Gamble Co. (PG +2.66%) rose after posting its largest year-over-year advance in sales in 20 years.
Treasuries strengthened as some on Wall Street suggested inflation may be peaking, with monetary policy tightening expectations overdone. Additionally, robust demand for the 20-year bond auction provided downward pressure on yields. The 10-year note yield fell nine basis points (0.09%) to 2.84% after climbing as high as 2.98% in overnight trading--a peak not seen since December 2018. Notably, 10-year real yields (which strip out the effects of inflation) briefly turned positive for the first time since March 2020.
In central bank news, the Federal Reserve’s Beige Book revealed economic activity expanded at a moderate pace from mid-February to early April despite businesses contending with ongoing labor shortages and elevated inflation. On the data front, MBA mortgage applications fell for a sixth consecutive week (-5%) as mortgage rates surged to a 12-year peak. Separately, existing home sales declined a smaller-than-projected 2.7% in March, while home prices climbed to record last month.
|
 Kenneth J. Gruneisen started out as a licensed stockbroker in August 1987, a couple of months prior to the historic stock market crash that took the Dow Jones Industrial Average down -22.6% in a single day. He has published daily fact-based fundamental and technical analysis on high-ranked stocks online for two decades. Through FACTBASEDINVESTING.COM, Kenneth provides educational articles, news, market commentary, and other information regarding proven investment systems that work in good times and bad.
Comments contained in the body of this report are technical opinions only and are not necessarily those of Gruneisen Growth Corp. The material herein has been obtained from sources believed to be reliable and accurate, however, its accuracy and completeness cannot be guaranteed. Our firm, employees, and customers may effect transactions, including transactions contrary to any recommendation herein, or have positions in the securities mentioned herein or options with respect thereto. Any recommendation contained in this report may not be suitable for all investors and it is not to be deemed an offer or solicitation on our part with respect to the purchase or sale of any securities. |
|
 |
Financial, Networking, Biotech, and Commodity-Linked Groups Rose
Kenneth J. Gruneisen - Passed the CAN SLIM® Master's Exam
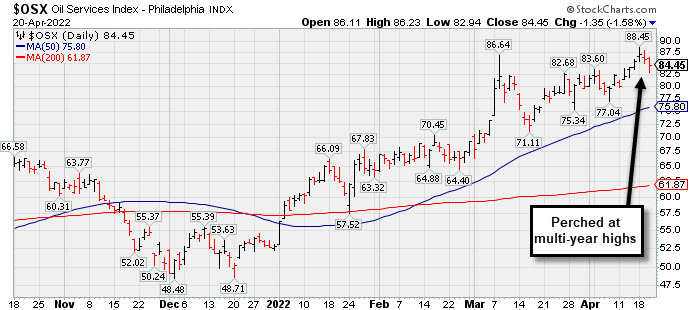
The Broker/Dealer Index ($XBD +0.54%) and Bank Index ($BKX +0.70%) both posted gains, meanwhile the Retail Index ($RLX -0.72%) created a drag on the major averages. The Networking Index ($NWX +1.00%) and Biotech Index ($BTK +0.84%) both posted gains, but the Semiconductor Index ($SOX -0.35%) edged lower. The Oil Services Index ($OSX -1.58%) ended lower while the Integrated Oil Index ($XOI +0.77%) and the Gold & Silver Index ($XAU +1.02%) both posted gains.
PICTURED: The Oil Services Index ($OSX -1.58%) is perched at multi-year highs.
| Oil Services |
$OSX |
84.45 |
-1.35 |
-1.58% |
+60.19% |
| Integrated Oil |
$XOI |
1,653.17 |
+12.63 |
+0.77% |
+40.31% |
| Semiconductor |
$SOX |
3,142.20 |
-11.03 |
-0.35% |
-20.37% |
| Networking |
$NWX |
855.45 |
+8.46 |
+1.00% |
-11.91% |
| Broker/Dealer |
$XBD |
453.35 |
+2.45 |
+0.54% |
-6.88% |
| Retail |
$RLX |
3,798.30 |
-27.57 |
-0.72% |
-10.13% |
| Gold & Silver |
$XAU |
165.22 |
+1.67 |
+1.02% |
+24.74% |
| Bank |
$BKX |
121.20 |
+0.84 |
+0.70% |
-8.33% |
| Biotech |
$BTK |
5,110.29 |
+42.73 |
+0.84% |
-7.40% |
|
|
|
 |
Featured Stocks
Kenneth J. Gruneisen - Passed the CAN SLIM® Master's Exam
|
|
|
Color Codes Explained :
Y - Better candidates highlighted by our
staff of experts.
G - Previously featured
in past reports as yellow but may no longer be buyable under the
guidelines.
***Last / Change / Volume data in this table is the closing quote data***
|
|
|
THESE ARE NOT BUY RECOMMENDATIONS!
Comments contained in the body of this report are technical
opinions only. The material herein has been obtained
from sources believed to be reliable and accurate, however,
its accuracy and completeness cannot be guaranteed.
This site is not an investment advisor, hence it does
not endorse or recommend any securities or other investments.
Any recommendation contained in this report may not
be suitable for all investors and it is not to be deemed
an offer or solicitation on our part with respect to
the purchase or sale of any securities. All trademarks,
service marks and trade names appearing in this report
are the property of their respective owners, and are
likewise used for identification purposes only.
This report is a service available
only to active Paid Premium Members.
You may opt-out of receiving report notifications
at any time. Questions or comments may be submitted
by writing to Premium Membership Services 665 S.E. 10 Street, Suite 201 Deerfield Beach, FL 33441-5634 or by calling 1-800-965-8307
or 954-785-1121.
|
|
|