You are not logged in.
This means you
CAN ONLY VIEW reports that were published prior to Tuesday, February 20, 2024.
You
MUST UPGRADE YOUR MEMBERSHIP if you want to see any current reports.
AFTER MARKET UPDATE - MONDAY, APRIL 20TH, 2020
Previous After Market Report Next After Market Report >>>
|
|
|
|
DOW |
-592.05 |
23,650.44 |
-2.44% |
|
Volume |
1,087,749,878 |
-22% |
|
Volume |
3,755,372,200 |
-13% |
|
NASDAQ |
-89.41 |
8,560.73 |
-1.03% |
|
Advancers |
675 |
23% |
|
Advancers |
1,246 |
38% |
|
S&P 500 |
-51.40 |
2,823.16 |
-1.79% |
|
Decliners |
2,242 |
77% |
|
Decliners |
2,006 |
62% |
|
Russell 2000 |
-15.75 |
1,213.35 |
-1.28% |
|
52 Wk Highs |
19 |
|
|
52 Wk Highs |
44 |
|
|
S&P 600 |
-14.46 |
708.12 |
-2.00% |
|
52 Wk Lows |
14 |
|
|
52 Wk Lows |
27 |
|
|
 |
Major Indices Fell With Lighter Volume Totals
Kenneth J. Gruneisen - Passed the CAN SLIM® Master's Exam
The Dow lost 592 points, while the S&P 500 retreated 1.8%. The Nasdaq Composite was down 1%. Breadth was negative as decliners led advancers by more than a 3-1 margin on the NYSE and by 5-3 on the Nasdaq exchange. The reported volume totals were lighter than the prior session totals on the NYSE and on the Nasdaq exchange, indicating less institutional selling pressure. There were 17 high-ranked companies from the Leaders List hit new 52-week highs and were listed on the BreakOuts Page, versus 23 on the prior session. New 52-week highs outnumbered the new 52-week lows on the NYSE and on the Nasdaq exchange. The follow-through day of big confirming gains on Monday, April 6th from the major indices on higher volume, coupled with an increase in the number of stocks hitting new highs, signaled a valid new market uptrend (M criteria). Any sustainable rally requires a healthy crop of new leaders, so it is important to see continued improvement in this area. Charts used courtesy of www.stockcharts.com
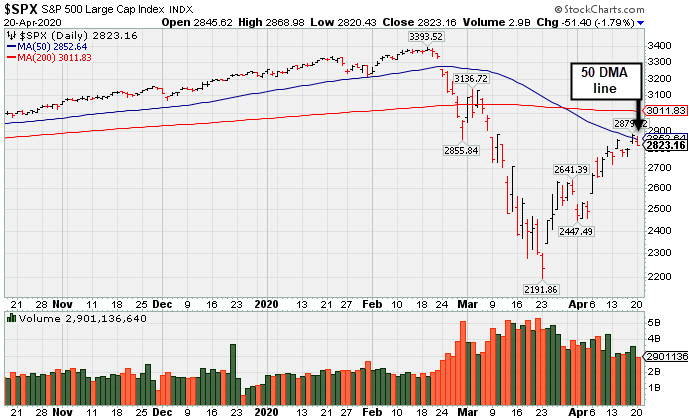
PICTURED: The S&P 500 Index paused near its 50-day moving average (DMA) line.
U.S. equities finished lower on Monday as increasing concerns surrounding a global supply glut caused the price of oil to collapse. This followed Friday’s session that capped the first back-to-back weekly advance for the S&P 500 in more than two months, and its strongest two-week performance since 1974.
WTI crude May futures expiring Tuesday plunged into unprecedented negative territory as insufficient storage capacity became more worrisome in the near-term. Further pressuring risk sentiment was a delay in a new fiscal stimulus package aimed at small business and hospitals.
All 11 S&P 500 closed in negative territory with Utilities, Real Estate, and Energy leading the decline. Industrials also underperformed, with Boeing (BA -6.75%) down following an analyst downgrade and news that the China Development Bank partially cancelled orders for the company’s 737-MAX aircrafts. In other corporate news, United Airlines (UAL -4.44%) fell after reporting a $2.1 billion pre-tax loss as the coronavirus outbreak pressured travel demand to its lowest point in decades. Elsewhere, Disney (DIS -4.10%) fell on the heels of multiple analyst downgrades. In earnings, Halliburton (HAL +0.66%) inched higher after a top and bottom line beat, and despite the oilfield services company cautioning investors that North American activity would fall sharply during this quarter.
Treasuries strengthened, with the yield on the 10-year note down four basis points to 0.61%. On the data front, a report from the Chicago Fed revealed U.S. economic activity declined more than expected in March. |
 Kenneth J. Gruneisen started out as a licensed stockbroker in August 1987, a couple of months prior to the historic stock market crash that took the Dow Jones Industrial Average down -22.6% in a single day. He has published daily fact-based fundamental and technical analysis on high-ranked stocks online for two decades. Through FACTBASEDINVESTING.COM, Kenneth provides educational articles, news, market commentary, and other information regarding proven investment systems that work in good times and bad.
Comments contained in the body of this report are technical opinions only and are not necessarily those of Gruneisen Growth Corp. The material herein has been obtained from sources believed to be reliable and accurate, however, its accuracy and completeness cannot be guaranteed. Our firm, employees, and customers may effect transactions, including transactions contrary to any recommendation herein, or have positions in the securities mentioned herein or options with respect thereto. Any recommendation contained in this report may not be suitable for all investors and it is not to be deemed an offer or solicitation on our part with respect to the purchase or sale of any securities. |
|
 |
Biotech and Gold & Silver Index Posted Gains
Kenneth J. Gruneisen - Passed the CAN SLIM® Master's Exam
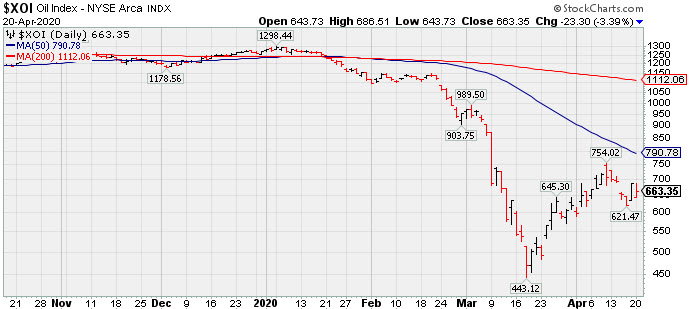
The financials sputtered as the Bank Index ($BKX -1.21%) and the Broker/Dealer Index ($XBD -1.79%) fell. The Retail Index ($RLX -0.58%) suffered a smaller loss. The tech sector was mixed as the Biotech Index ($BTK +2.06%) rose and the Networking Index ($NWX +0.14%) eked out a small gain while the Semiconductor Index ($SOX -2.23%) fell. The Gold & Silver Index ($XAU +2.02%) rose along with the Oil Services Index ($OSX +1.04%). PICTURED: The Integrated Oil Index ($XOI -3.39%) slumped. It has been rebounding toward its 50-day moving average (DMA) line from its March 2020 low.
| Oil Services |
$OSX |
26.42 |
+0.27 |
+1.03% |
-66.25% |
| Integrated Oil |
$XOI |
663.35 |
-23.30 |
-3.39% |
-47.79% |
| Semiconductor |
$SOX |
1,667.57 |
-38.07 |
-2.23% |
-9.84% |
| Networking |
$NWX |
510.36 |
+0.72 |
+0.14% |
-12.52% |
| Broker/Dealer |
$XBD |
227.58 |
-4.16 |
-1.79% |
-21.63% |
| Retail |
$RLX |
2,566.92 |
-14.97 |
-0.58% |
+4.80% |
| Gold & Silver |
$XAU |
106.39 |
+2.11 |
+2.02% |
-0.50% |
| Bank |
$BKX |
69.15 |
-0.85 |
-1.21% |
-39.00% |
| Biotech |
$BTK |
5,291.07 |
+107.03 |
+2.06% |
+4.41% |
|
|
|
 |
Featured Stocks
Kenneth J. Gruneisen - Passed the CAN SLIM® Master's Exam
As leadership improves the number of stocks covered in this area should be expected to increase gradually, as superior candidates are added to the Featured Stocks list on a case-by-case basis. Feel free to contact us if you have a need for any additional information. |
|
|
Color Codes Explained :
Y - Better candidates highlighted by our
staff of experts.
G - Previously featured
in past reports as yellow but may no longer be buyable under the
guidelines.
***Last / Change / Volume data in this table is the closing quote data***
|
|
|
THESE ARE NOT BUY RECOMMENDATIONS!
Comments contained in the body of this report are technical
opinions only. The material herein has been obtained
from sources believed to be reliable and accurate, however,
its accuracy and completeness cannot be guaranteed.
This site is not an investment advisor, hence it does
not endorse or recommend any securities or other investments.
Any recommendation contained in this report may not
be suitable for all investors and it is not to be deemed
an offer or solicitation on our part with respect to
the purchase or sale of any securities. All trademarks,
service marks and trade names appearing in this report
are the property of their respective owners, and are
likewise used for identification purposes only.
This report is a service available
only to active Paid Premium Members.
You may opt-out of receiving report notifications
at any time. Questions or comments may be submitted
by writing to Premium Membership Services 665 S.E. 10 Street, Suite 201 Deerfield Beach, FL 33441-5634 or by calling 1-800-965-8307
or 954-785-1121.
|
|
|