You are not logged in.
This means you
CAN ONLY VIEW reports that were published prior to Sunday, February 25, 2024.
You
MUST UPGRADE YOUR MEMBERSHIP if you want to see any current reports.
AFTER MARKET UPDATE - TUESDAY, APRIL 19TH, 2022
Previous After Market Report Next After Market Report >>>
|
|
|
|
DOW |
+499.51 |
34,911.20 |
+1.45% |
|
Volume |
856,370,665 |
+3% |
|
Volume |
4,520,946,600 |
+6% |
|
NASDAQ |
+287.30 |
13,619.66 |
+2.15% |
|
Advancers |
2,160 |
67% |
|
Advancers |
3,052 |
69% |
|
S&P 500 |
+70.52 |
4,462.21 |
+1.61% |
|
Decliners |
1,041 |
33% |
|
Decliners |
1,345 |
31% |
|
Russell 2000 |
+40.63 |
2,030.77 |
+2.04% |
|
52 Wk Highs |
99 |
|
|
52 Wk Highs |
89 |
|
|
S&P 600 |
+24.25 |
1,303.80 |
+1.90% |
|
52 Wk Lows |
285 |
|
|
52 Wk Lows |
306 |
|
|
 |
Breadth Positive as Major Averages Rose With Greater Volume
Kenneth J. Gruneisen - Passed the CAN SLIM® Master's Exam
The Dow advanced 499 points, turning positive month-to-date. The S&P 500 and Nasdaq Composite each notched their best one-day performance in a month, jumping 1.6% and 2.2%, respectively. Volume totals reported were higher than the prior session on the NYSE and on the Nasdaq exchange, indicating an increase in institutional buying demand. Breadth was positive as advancers led decliners by more than a 2-1 margin on the NYSE and on the Nasdaq exchange. There were 39 high-ranked companies from the Leaders List that hit new 52-week highs and were listed on the BreakOuts Page, versus 32 on the prior session. New 52-week lows totals expanded and solidly outnumbered new 52-week highs on the NYSE and on the Nasdaq exchange. The major indices are in an uptrend that has come under pressure (M criteria). Strict followers of the fact-based investment system only buy stocks fitting all key fundamental and technical investment criteria.
Chart courtesy of www.stockcharts.com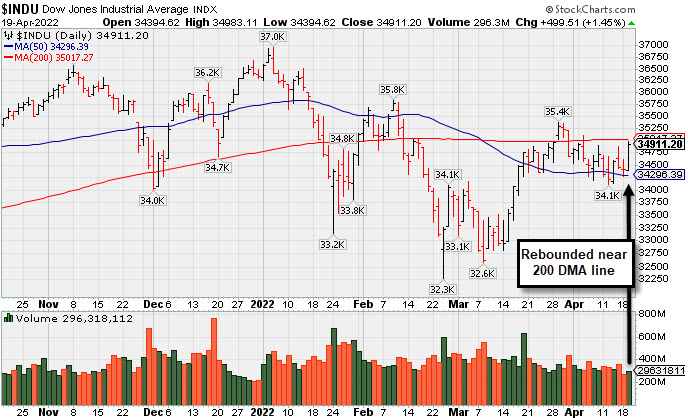 PICTURED: The Dow Jones Industrial Average rebounded near its 200-day moving average (DMA) line.
U.S. equities staged a relief rally on Tuesday as Wall Street digested central bank commentary and corporate earnings reports. Depressed sentiment and positioning levels serving as contrarian indicators were widely cited as supportive of risk appetite.
Hawkish remarks from St. Louis Federal Reserve (Fed) President Bullard were in focus, as he said more aggressive 0.75% rate hikes--while not his base case--“should not be ruled out” as a policy tool to quickly move interest rates to a neutral level. Market participants are essentially pricing in a bigger-than-normal 0.50% rate increase at the upcoming May 3-4 policy meeting. A rout in Treasuries deepened, with the yield on the 10-year note up seven basis points (0.07%) to 2.93%, while the 30-year bond yield briefly traded at 3.00% for the first time in three years. The more Fed-sensitive two-year note yield spiked 13 basis points (0.13%) to 2.59%. On the data front, both housing starts and building permits unexpectedly advanced in March, up 0.3% and 0.4%, respectively.
Seven of 11 S&P 500 sectors rose more than 1%, with growth-related stocks outperforming alongside companies benefiting from reopening activity. Energy was the lone laggard as West Texas Intermediate crude slumped 5% to $102.81/barrel. In earnings, Johnson & Johnson (JNJ +3.05%) rose as a dividend boost helped offset disappointing first-quarter sales. Meanwhile, Travelers Companies Inc. (TRV -4.89%) fell as a closely watched underwriting metric fell short of expectations, overshadowing an otherwise upbeat report.
|
 Kenneth J. Gruneisen started out as a licensed stockbroker in August 1987, a couple of months prior to the historic stock market crash that took the Dow Jones Industrial Average down -22.6% in a single day. He has published daily fact-based fundamental and technical analysis on high-ranked stocks online for two decades. Through FACTBASEDINVESTING.COM, Kenneth provides educational articles, news, market commentary, and other information regarding proven investment systems that work in good times and bad.
Comments contained in the body of this report are technical opinions only and are not necessarily those of Gruneisen Growth Corp. The material herein has been obtained from sources believed to be reliable and accurate, however, its accuracy and completeness cannot be guaranteed. Our firm, employees, and customers may effect transactions, including transactions contrary to any recommendation herein, or have positions in the securities mentioned herein or options with respect thereto. Any recommendation contained in this report may not be suitable for all investors and it is not to be deemed an offer or solicitation on our part with respect to the purchase or sale of any securities. |
|
 |
Retail, Financial, and Tech Indexes Rose
Kenneth J. Gruneisen - Passed the CAN SLIM® Master's Exam
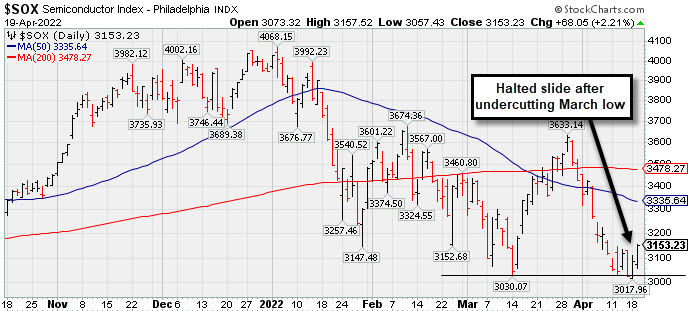
The Retail Index ($RLX +3.06%), Broker/Dealer Index ($XBD +2.55%), and Bank Index ($BKX +2.18%) each posted a solid gain that helped underpin the major averages. The tech sector had a positive bias as the Semiconductor Index ($SOX +2.21%) and Networking Index ($NWX +1.38%) both outpaced the Biotech Index ($BTK +0.51%). Meanwhile, commodity-linked groups had a negative bias as the Gold & Silver Index ($XAU -2.51%), Oil Services Index ($OSX -1.44%), and Integrated Oil Index ($XOI -0.87%) ended unanimously lower. PICTURED: The Semiconductor Index ($SOX +2.21%) halted its slide after undercutting its March 2022 low.
| Oil Services |
$OSX |
85.81 |
-1.25 |
-1.44% |
+62.76% |
| Integrated Oil |
$XOI |
1,640.54 |
-14.34 |
-0.87% |
+39.24% |
| Semiconductor |
$SOX |
3,153.23 |
+68.05 |
+2.21% |
-20.09% |
| Networking |
$NWX |
846.98 |
+11.52 |
+1.38% |
-12.78% |
| Broker/Dealer |
$XBD |
450.90 |
+11.19 |
+2.55% |
-7.39% |
| Retail |
$RLX |
3,825.87 |
+113.68 |
+3.06% |
-9.48% |
| Gold & Silver |
$XAU |
163.55 |
-4.22 |
-2.51% |
+23.48% |
| Bank |
$BKX |
120.36 |
+2.57 |
+2.18% |
-8.97% |
| Biotech |
$BTK |
5,067.56 |
+25.64 |
+0.51% |
-8.17% |
|
|
|
 |
Featured Stocks
Kenneth J. Gruneisen - Passed the CAN SLIM® Master's Exam
|
|
|
Color Codes Explained :
Y - Better candidates highlighted by our
staff of experts.
G - Previously featured
in past reports as yellow but may no longer be buyable under the
guidelines.
***Last / Change / Volume data in this table is the closing quote data***
Symbol/Exchange
Company Name
Industry Group |
PRICE |
CHANGE
(%Change) |
Day High |
Volume
(% DAV)
(% 50 day avg vol) |
52 Wk Hi
% From Hi |
Featured
Date |
Price
Featured |
Pivot Featured |
|
Max Buy |
 REGN
-
NASDAQ
REGN
-
NASDAQ
Regeneron Pharmaceutical
DRUGS - Biotechnology
|
$716.22
|
-6.98
-0.97% |
$725.81
|
467,976
67.24% of 50 DAV
50 DAV is 696,000
|
$747.42
-4.17%
|
3/14/2022
|
$647.95
|
PP = $673.96
|
|
MB = $707.66
|
Most Recent Note - 4/18/2022 4:41:31 PM
G - Pulled back today with light volume. It has been repeatedly noted as extended from any sound base. Prior highs ($686 and $673) define initial support to watch above its 50 DMA line ($659).
>>> FEATURED STOCK ARTICLE : Volume Totals Have Been Light While Hovering at All-Time High - 4/4/2022 |
View all notes |
Set NEW NOTE alert |
Company Profile |
SEC
News |
Chart |
Request a new note
C
A
S
I |
IMKTA
-
NASDAQ
Ingles Markets Inc Cl A
RETAIL - Grocery Stores
|
$99.94
|
+4.41
4.62% |
$100.04
|
151,403
132.81% of 50 DAV
50 DAV is 114,000
|
$96.80
3.24%
|
4/11/2022
|
$96.25
|
PP = $95.75
|
|
MB = $100.54
|
 Most Recent Note - 4/19/2022 12:30:16 PM
Y - Hitting a new 52-week high today. Posted a gain on the prior session with +25% above average volume for a best-ever close. Highlighted in yellow with pivot point cited based on its 3/21/22 high after a cup-with-high-handle base pattern. Subsequent gains backed by at least +40% above average volume and a strong close above the pivot point may clinch a technical buy signal. Reported Dec '21 earnings +31% on +17% sales revenues versus the year ago period. Three of the past 4 quarterly comparisons were above the +25% minimum earnings guideline (C criteria). Annual earnings growth (A criteria) has been very strong in recent years.
>>> FEATURED STOCK ARTICLE : Closed Near Session Low and Below Pivot Point Cited - 4/11/2022 |
View all notes |
Set NEW NOTE alert |
Company Profile |
SEC
News |
Chart |
Request a new note
C
A
S
I |
SMPL
-
NASDAQ
Simply Good Foods Co
Food-Confectionery
|
$44.57
|
+1.43
3.31% |
$45.14
|
1,463,828
238.80% of 50 DAV
50 DAV is 613,000
|
$43.85
1.64%
|
4/13/2022
|
$41.79
|
PP = $43.27
|
|
MB = $45.43
|
Most Recent Note - 4/19/2022 5:33:35 PM
Y - Posted a solid confirming gain today with +132% above average volume, following through after a noted gain on 4/14/22 triggered a technical buy signal. Reported Feb '22 quarterly earnings +44% on +29% sales revenues versus the year ago period, its 4th strong quarterly comparison.
>>> FEATURED STOCK ARTICLE : Simply Good Foods Had a Great Breakout - 4/14/2022 |
View all notes |
Set NEW NOTE alert |
Company Profile |
SEC
News |
Chart |
Request a new note
C
A
S
I |
IMXI
-
NASDAQ
International Money Exp
Financial Svcs-Specialty
|
$20.54
|
+0.04
0.20% |
$20.73
|
193,648
52.48% of 50 DAV
50 DAV is 369,000
|
$21.98
-6.55%
|
3/8/2022
|
$18.64
|
PP = $19.06
|
|
MB = $20.01
|
Most Recent Note - 4/18/2022 5:01:20 PM
G - It has not formed a sound base of sufficient length. Prior highs in the high $18 area nearly coincide with its 50 DMA line ($18.47) defining important near term support to watch on pullbacks. See the latest FSU analysis for more details and a new annotated graph.
>>> FEATURED STOCK ARTICLE : Consolidating After Rally From Previously Noted Base - 4/18/2022 |
View all notes |
Set NEW NOTE alert |
Company Profile |
SEC
News |
Chart |
Request a new note
C
A
S
I |
|
|
|
THESE ARE NOT BUY RECOMMENDATIONS!
Comments contained in the body of this report are technical
opinions only. The material herein has been obtained
from sources believed to be reliable and accurate, however,
its accuracy and completeness cannot be guaranteed.
This site is not an investment advisor, hence it does
not endorse or recommend any securities or other investments.
Any recommendation contained in this report may not
be suitable for all investors and it is not to be deemed
an offer or solicitation on our part with respect to
the purchase or sale of any securities. All trademarks,
service marks and trade names appearing in this report
are the property of their respective owners, and are
likewise used for identification purposes only.
This report is a service available
only to active Paid Premium Members.
You may opt-out of receiving report notifications
at any time. Questions or comments may be submitted
by writing to Premium Membership Services 665 S.E. 10 Street, Suite 201 Deerfield Beach, FL 33441-5634 or by calling 1-800-965-8307
or 954-785-1121.
|
|
|