You are not logged in.
This means you
CAN ONLY VIEW reports that were published prior to Sunday, February 25, 2024.
You
MUST UPGRADE YOUR MEMBERSHIP if you want to see any current reports.
AFTER MARKET UPDATE - MONDAY, APRIL 18TH, 2022
Previous After Market Report Next After Market Report >>>
|
|
|
|
DOW |
-39.54 |
34,411.69 |
-0.11% |
|
Volume |
828,459,688 |
-10% |
|
Volume |
4,250,443,000 |
-8% |
|
NASDAQ |
-18.72 |
13,332.36 |
-0.14% |
|
Advancers |
1,209 |
37% |
|
Advancers |
1,550 |
33% |
|
S&P 500 |
-0.90 |
4,391.69 |
-0.02% |
|
Decliners |
2,049 |
63% |
|
Decliners |
3,119 |
67% |
|
Russell 2000 |
-14.85 |
1,990.13 |
-0.74% |
|
52 Wk Highs |
157 |
|
|
52 Wk Highs |
93 |
|
|
S&P 600 |
-4.73 |
1,279.55 |
-0.37% |
|
52 Wk Lows |
321 |
|
|
52 Wk Lows |
512 |
|
|
 |
Breadth Negative as Major Averages Quietly Sputter
Kenneth J. Gruneisen - Passed the CAN SLIM® Master's Exam
The S&P 500 ended just below the flat line, while the Nasdaq Composite dipped 0.1% following a downbeat holiday-shortened week during which the benchmarks fell 2.1% and 2.6%, respectively. The Dow lost 39 points on the heels of its third straight weekly drawdown (-0.8%). Volume totals reported were lighter than the prior session on the NYSE and on the Nasdaq exchange. Breadth was negative as decliners led advancers by almost a 2-1 margin on the NYSE and on the Nasdaq exchange. There were 32 high-ranked companies from the Leaders List that hit new 52-week highs and were listed on the BreakOuts Page, versus 40 on the prior session. New 52-week lows totals expanded and solidly outnumbered new 52-week highs on the NYSE and on the Nasdaq exchange. The major indices are in an uptrend that has come under pressure (M criteria). Strict followers of the fact-based investment system only buy stocks fitting all key fundamental and technical investment criteria.
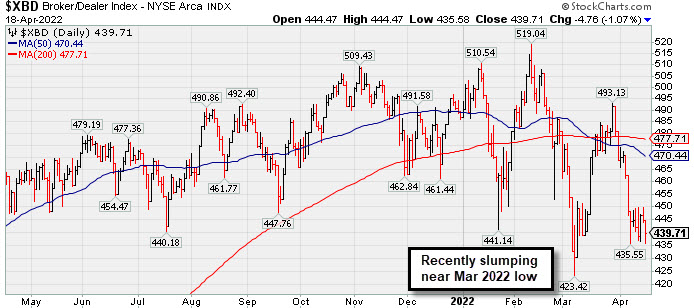
Chart courtesy of www.stockcharts.com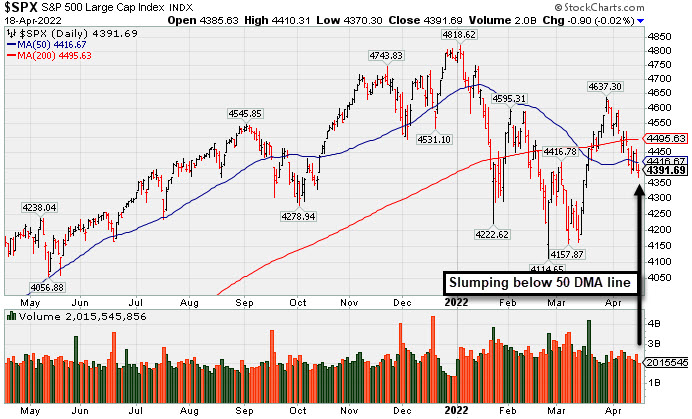 PICTURED: The S&P 500 Index has slumped back below its 200-day and 50-day moving average (DMA) lines following an impressive March rebound.
U.S. stocks finished modestly lower in choppy trading on Monday as investors monitored rising Treasury yields and awaited a busy week of corporate earnings. Trading volume was light, roughly 20% below the 30-day average, with most European markets closed in observance of Easter.
Six of 11 S&P 500 sectors ended in negative territory with the more traditionally defensive Health Care and Consumer Staples losing the most. Financials bucked the downtrend, with Bank of America Corp. (BAC +3.41%) rose as strong trading revenue overshadowed a 13% year-over-year decline in earnings. However, Charles Schwab Corp. (SCHW -9.44%) weathered its worst session in over two years as weakness in its trading operations contributed to a disappointing profit tally. In other corporate news, Twitter Inc. (TWTR +7.48%) rose after its board of directors adopted a poison pill to stop Tesla Inc.’s (TSLA +1.96%) CEO Elon Musk from advancing his stake in the company beyond 15%.
Longer-dated Treasuries extended their rout as market participants braced for a more aggressive path of monetary policy tightening in light of persistent inflation. The yield on the 10-year note rose three basis points (0.03%) to 2.86%, its highest level since December 2018. On the data front, a measure of homebuilder sentiment eased to a seven-month low in April. In commodities, West Texas Intermediate crude climbed 0.8% to $107.84/barrel, while U.S. natural gas prices soared to a 13-year peak.
|
 Kenneth J. Gruneisen started out as a licensed stockbroker in August 1987, a couple of months prior to the historic stock market crash that took the Dow Jones Industrial Average down -22.6% in a single day. He has published daily fact-based fundamental and technical analysis on high-ranked stocks online for two decades. Through FACTBASEDINVESTING.COM, Kenneth provides educational articles, news, market commentary, and other information regarding proven investment systems that work in good times and bad.
Comments contained in the body of this report are technical opinions only and are not necessarily those of Gruneisen Growth Corp. The material herein has been obtained from sources believed to be reliable and accurate, however, its accuracy and completeness cannot be guaranteed. Our firm, employees, and customers may effect transactions, including transactions contrary to any recommendation herein, or have positions in the securities mentioned herein or options with respect thereto. Any recommendation contained in this report may not be suitable for all investors and it is not to be deemed an offer or solicitation on our part with respect to the purchase or sale of any securities. |
|
 |
Energy-Linked Groups and Semiconductor Index Rose
Kenneth J. Gruneisen - Passed the CAN SLIM® Master's Exam
The Oil Services Index ($OSX +1.89%) and Integrated Oil Index ($XOI +1.73%) both posted solid gains while the Gold & Silver Index ($XAU +0.00%) finished flat. The Semiconductor Index ($SOX +1.88%) posted solid gain while the Networking Index ($NWX -0.23%) edged lower and the Biotech Index ($BTK -3.56%) slumped for a larger loss. Financial indexes were mixed as the Bank Index ($BKX +0.91%) rose while the Broker/Dealer Index ($XBD -1.07%) lost ground. The Retail Index ($RLX +0.15%) inched higher. PICTURED: The Broker/Dealer Index ($XBD -1.07%) has recently been slumping near its March 2022 low.
| Oil Services |
$OSX |
87.06 |
+1.61 |
+1.89% |
+65.14% |
| Integrated Oil |
$XOI |
1,654.88 |
+28.07 |
+1.73% |
+40.46% |
| Semiconductor |
$SOX |
3,085.19 |
+56.96 |
+1.88% |
-21.82% |
| Networking |
$NWX |
835.46 |
-1.88 |
-0.23% |
-13.97% |
| Broker/Dealer |
$XBD |
439.71 |
-4.76 |
-1.07% |
-9.68% |
| Retail |
$RLX |
3,712.19 |
+5.52 |
+0.15% |
-12.17% |
| Gold & Silver |
$XAU |
167.76 |
+0.01 |
+0.00% |
+26.66% |
| Bank |
$BKX |
117.79 |
+1.06 |
+0.91% |
-10.91% |
| Biotech |
$BTK |
5,041.92 |
-186.12 |
-3.56% |
-8.64% |
|
|
|
 |
Consolidating After Rally From Previously Noted Base
Kenneth J. Gruneisen - Passed the CAN SLIM® Master's Exam
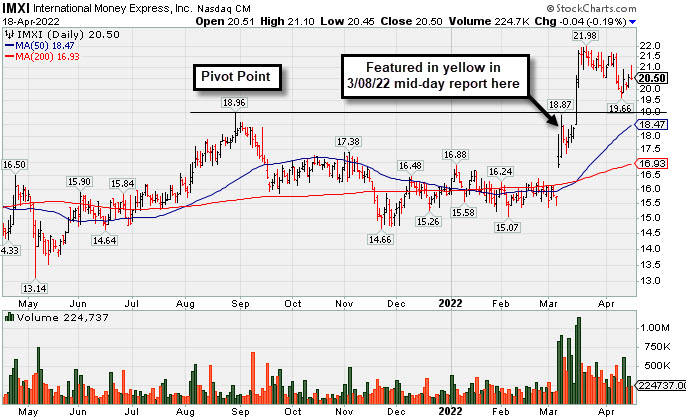
International Money Express (IMXI -$0.04 or -0.19% to $20.50) has not formed a sound base of sufficient length. Prior highs in the high $18 area nearly coincide with its 50-day moving average (DMA) line ($18.47) defining important near term support to watch on pullbacks.
IMXI was highlighted in yellow in the 3/08/22 mid-day report (read here) with pivot point cited based on its 8/30/21 high plus 10 cents. It was last shown with detailed analysis on 3/24/22 with an annotated graph under the headline, "Holding Ground After Rallying From Prior Base".
Through the Dec '21 quarter the Financial Services-Specialty firm's quarterly and annual earnings (C and A criteria) history has been strong and backed by solid sales revenues growth. The past 6 quarterly comparisons showed earnings increases above the year ago period by more than +25% (C criteria). Annual earnings growth has been strong and it has a 95 Earnings Per Share Rating.
There is a small supply of only 38.3 million shares outstanding (S criteria) which can contribute to greater price volatility in the event of institutional buying or selling. The number of top-rated funds owning its shares rose from 210 in Mar '21 to 255 in Mar '221, a reassuring sign concerning the I criteria. Its current Up/Down Volume Ratio of 1.3 is an unbiased indication its shares have been under accumulation over the past 50 days.
|
|
|
Color Codes Explained :
Y - Better candidates highlighted by our
staff of experts.
G - Previously featured
in past reports as yellow but may no longer be buyable under the
guidelines.
***Last / Change / Volume data in this table is the closing quote data***
|
|
|
THESE ARE NOT BUY RECOMMENDATIONS!
Comments contained in the body of this report are technical
opinions only. The material herein has been obtained
from sources believed to be reliable and accurate, however,
its accuracy and completeness cannot be guaranteed.
This site is not an investment advisor, hence it does
not endorse or recommend any securities or other investments.
Any recommendation contained in this report may not
be suitable for all investors and it is not to be deemed
an offer or solicitation on our part with respect to
the purchase or sale of any securities. All trademarks,
service marks and trade names appearing in this report
are the property of their respective owners, and are
likewise used for identification purposes only.
This report is a service available
only to active Paid Premium Members.
You may opt-out of receiving report notifications
at any time. Questions or comments may be submitted
by writing to Premium Membership Services 665 S.E. 10 Street, Suite 201 Deerfield Beach, FL 33441-5634 or by calling 1-800-965-8307
or 954-785-1121.
|
|
|