***Last / Change / Volume data in this table is the closing quote data***
Symbol/Exchange
Company Name
Industry Group |
PRICE |
CHANGE
(%Change) |
Day High |
Volume
(% DAV)
(% 50 day avg vol) |
52 Wk Hi
% From Hi |
Featured
Date |
Price
Featured |
Pivot Featured |
|
Max Buy |
MLR
-
NYSE
Miller Industries Inc
AUTOMOTIVE - Auto Parts
|
$34.38
|
+1.01
3.03% |
$34.59
|
25,799
64.50% of 50 DAV
50 DAV is 40,000
|
$35.26
-2.50%
|
11/30/2018
|
$28.35
|
PP = $29.50
|
|
MB = $30.98
|
Most Recent Note - 4/16/2019 5:56:33 PM
G - Posted a big gain today with light volume, rallying further above its 50 DMA line ($32.22) toward the prior high. Below the 50 DMA line the prior low ($30.38 on 3/27/19) defines the next near-term support to watch. Reported earnings +17% on +13% sales revenues for the Dec '18 quarter, below the +25% minimum guideline (C criteria), raising fundamental concerns.
>>> FEATURED STOCK ARTICLE : Below 50-Day Average After Damaging Losses - 4/8/2019 |
View all notes |
Set NEW NOTE alert |
Company Profile |
SEC
News |
Chart |
Request a new note
C
A
S
I |
NSP
-
NYSE
Insperity Inc
Comml Svcs-Outsourcing
|
$121.06
|
-3.81
-3.05% |
$125.02
|
605,454
165.42% of 50 DAV
50 DAV is 366,000
|
$132.50
-8.63%
|
4/16/2019
|
$129.59
|
PP = $132.60
|
|
MB = $139.23
|
 Most Recent Note - 4/18/2019 5:30:30 PM
G - Violated its 50 DMA line ($125.08) and triggered a technical sell signal with higher volume behind today's 5th consecutive loss and its color code is changed to green. A prompt rebound above the 50 DMA line is needed for its outlook to improve. A new pivot point was cited based on its 2/12/19 high plus 10 cents. Subsequent gains above the pivot point backed by at least +40% above average volume may trigger a new (or add-on) technical buy signal. Prior highs in the $118-121 area recently acted as support.
>>> FEATURED STOCK ARTICLE : Volume Totals Cooling and Consolidating Near Prior Highs - 3/14/2019 |
View all notes |
Set NEW NOTE alert |
Company Profile |
SEC
News |
Chart |
Request a new note
C
A
S
I |
ZBRA
-
NASDAQ
Zebra Tech Corp Cl A
COMPUTER HARDWARE - Computer Peripherals
|
$232.68
|
+0.46
0.20% |
$233.79
|
309,660
67.32% of 50 DAV
50 DAV is 460,000
|
$235.98
-1.40%
|
2/14/2019
|
$198.10
|
PP = $184.85
|
|
MB = $194.09
|
Most Recent Note - 4/18/2019 11:05:15 AM
G - Perched at its all-time high, very extended from any sound base. Its 50 DMA line ($208) defines near-term support to watch on pullbacks.
>>> FEATURED STOCK ARTICLE : Zebra Extended From Prior Base - 3/25/2019 |
View all notes |
Set NEW NOTE alert |
Company Profile |
SEC
News |
Chart |
Request a new note
C
A
S
I |
FTNT
-
NASDAQ
Fortinet Inc
Computer Sftwr-Security
|
$91.08
|
-1.29
-1.40% |
$91.12
|
2,187,125
123.85% of 50 DAV
50 DAV is 1,766,000
|
$96.96
-6.06%
|
4/10/2019
|
$89.76
|
PP = $88.70
|
|
MB = $93.14
|
Most Recent Note - 4/18/2019 10:52:19 AM
Y - Color code is changed to yellow after pulling back below its "max buy" level. Testing prior highs in the $88 area defining near-term support above its 50 DMA line ($85.34).
>>> FEATURED STOCK ARTICLE : Volume-Driven Gain Cleared Flat Base and Little Resistance Remains - 4/10/2019 |
View all notes |
Set NEW NOTE alert |
Company Profile |
SEC
News |
Chart |
Request a new note
C
A
S
I |
SPSC
-
NASDAQ
S P S Commerce Inc
COMPUTER SOFTWARE and SERVICES - Application Software
|
$101.18
|
-0.07
-0.07% |
$101.63
|
114,527
70.70% of 50 DAV
50 DAV is 162,000
|
$113.31
-10.71%
|
3/26/2019
|
$107.12
|
PP = $113.41
|
|
MB = $119.08
|
Most Recent Note - 4/17/2019 5:43:00 PM
G - Color code is changed to green after slumping below its 50 DMA line ($104.88) which recently acted as support. Damaging losses below the recent low ($100.28 on 4/08/19) would raise more serious concerns. A rebound above the 50 DMA line is needed for its outlook to improve. Subsequent gains above the pivot point backed by at least +40% above average volume may trigger a new (or add-on) technical buy signal.
>>> FEATURED STOCK ARTICLE : Consolidating in Orderly Fashion Above Prior Highs - 3/22/2019 |
View all notes |
Set NEW NOTE alert |
Company Profile |
SEC
News |
Chart |
Request a new note
C
A
S
I |
Symbol/Exchange
Company Name
Industry Group |
PRICE |
CHANGE
(%Change) |
Day High |
Volume
(% DAV)
(% 50 day avg vol) |
52 Wk Hi
% From Hi |
Featured
Date |
Price
Featured |
Pivot Featured |
|
Max Buy |
SSNC
-
NASDAQ
S S & C Technologies
COMPUTER SOFTWARE and SERVICES - Application Software
|
$64.21
|
+0.24
0.38% |
$64.40
|
1,332,794
77.85% of 50 DAV
50 DAV is 1,712,000
|
$66.30
-3.15%
|
2/15/2019
|
$59.73
|
PP = $61.07
|
|
MB = $64.12
|
Most Recent Note - 4/16/2019 1:34:34 PM
G - Stubbornly holding its ground perched near its all-time high with volume totals cooling. Its 50 DMA line ($61.15) and prior low define near term support to watch on pullbacks.
>>> FEATURED STOCK ARTICLE : Hovering Near High With Volume Totals Cooling in Recent Weeks - 3/27/2019 |
View all notes |
Set NEW NOTE alert |
Company Profile |
SEC
News |
Chart |
Request a new note
C
A
S
I |
IRBT
-
NASDAQ
Irobot Corp
CONSUMER DURABLES - Electronic Equipment
|
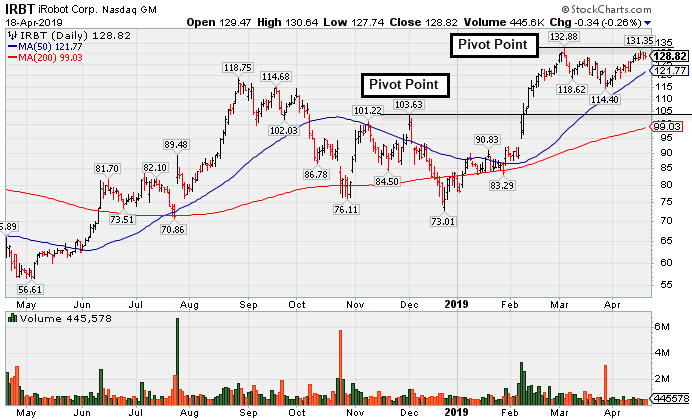
$128.82
|
-0.34
-0.26% |
$130.64
|
445,578
53.56% of 50 DAV
50 DAV is 832,000
|
$132.88
-3.06%
|
4/16/2019
|
$130.56
|
PP = $132.98
|
|
MB = $139.63
|
Most Recent Note - 4/18/2019 5:27:11 PM
Y - Volume totals have been cooling in recent weeks and a new pivot point was cited based on its 3/05/19 high plus 10 cents. Subsequent gains above the pivot point backed by at least +40% above average volume may trigger a new (or add-on) technical buy signal. Its 50 DMA line ($121.77) and recent low ($114.40 on 3/27/19) define important near-term support to watch on pullbacks. See the latest FSU analysis for more details and a new annotated graph.
>>> FEATURED STOCK ARTICLE : Household Appliance Firm Quietly Hovers Near All-Time High - 4/18/2019 |
View all notes |
Set NEW NOTE alert |
Company Profile |
SEC
News |
Chart |
Request a new note
C
A
S
I |
AUDC
-
NASDAQ
Audiocodes Ltd
ELECTRONICS - Scientific and Technical Instrum
|
$16.02
|
+0.48
3.09% |
$16.11
|
185,166
96.44% of 50 DAV
50 DAV is 192,000
|
$16.36
-2.05%
|
3/20/2019
|
$13.66
|
PP = $15.06
|
|
MB = $15.81
|
Most Recent Note - 4/18/2019 10:56:22 AM
Y - Volume totals have been light while holding its ground near its "max buy" level and not far from its 52-week high. Prior high ($14.96) defines initial support to watch above its 50 DMA line ($14.02).
>>> FEATURED STOCK ARTICLE : Building a Base and Found Support Near 50-Day Moving Average - 3/20/2019 |
View all notes |
Set NEW NOTE alert |
Company Profile |
SEC
News |
Chart |
Request a new note
C
A
S
I |
ENV
-
NYSE
Envestnet Inc
FINANCIAL SERVICES - Diversified Investments
|
$69.67
|
+0.49
0.71% |
$69.81
|
221,831
74.44% of 50 DAV
50 DAV is 298,000
|
$69.95
-0.40%
|
3/15/2019
|
$66.05
|
PP = $64.90
|
|
MB = $68.15
|
Most Recent Note - 4/18/2019 10:57:28 AM
G - Perched near its "max buy" level and not far from its all-time high. The recent low ($63.34 on 3/27/19) and 50 DMA line ($62.94) define near-term support to watch on pullbacks.
>>> FEATURED STOCK ARTICLE : Volume Heavy Behind Rally to New Highs - 3/15/2019 |
View all notes |
Set NEW NOTE alert |
Company Profile |
SEC
News |
Chart |
Request a new note
C
A
S
I |
LHCG
-
NASDAQ
L H C Group Inc
HEALTH SERVICES - Home Health Care
|
$100.67
|
+1.04
1.04% |
$101.46
|
274,221
106.29% of 50 DAV
50 DAV is 258,000
|
$115.54
-12.87%
|
1/23/2019
|
$107.29
|
PP = $107.61
|
|
MB = $112.99
|
Most Recent Note - 4/17/2019 12:48:47 PM
G - Finding prompt support at its 200 DMA line ($99.13) today after a damaging volume-driven loss on the prior session violated the prior low ($106.04 on 3/28/19). Disciplined investors always limit losses by selling any stock that falls more than -7% from their purchase price. A rebound above the 50 DMA line is needed for its outlook to improve.
>>> FEATURED STOCK ARTICLE : Sputtering Near 50-Day Moving Average Line - 4/1/2019 |
View all notes |
Set NEW NOTE alert |
Company Profile |
SEC
News |
Chart |
Request a new note
C
A
S
I |
Symbol/Exchange
Company Name
Industry Group |
PRICE |
CHANGE
(%Change) |
Day High |
Volume
(% DAV)
(% 50 day avg vol) |
52 Wk Hi
% From Hi |
Featured
Date |
Price
Featured |
Pivot Featured |
|
Max Buy |
ENSG
-
NASDAQ
Ensign Group Inc
HEALTH SERVICES - Long-Term Care Facilities
|
$48.25
|
+0.70
1.47% |
$48.93
|
226,555
69.71% of 50 DAV
50 DAV is 325,000
|
$54.56
-11.57%
|
2/7/2019
|
$48.71
|
PP = $49.06
|
|
MB = $51.51
|
Most Recent Note - 4/17/2019 5:31:07 PM
G - Undercut prior lows with a loss on higher volume today raising more concerns after it violated its 50 DMA line ($50.30) on the prior session. Only a prompt rebound above the 50 DMA line would help its outlook improve. See the latest FSU analysis for more details and a new annotated graph.
>>> FEATURED STOCK ARTICLE : Two Damaging Losses Hurt Outlook - 4/17/2019 |
View all notes |
Set NEW NOTE alert |
Company Profile |
SEC
News |
Chart |
Request a new note
C
A
S
I |
LULU
-
NASDAQ
Lululemon Athletica
MANUFACTURING - Textile Manufacturing
|
$173.31
|
+2.08
1.21% |
$174.64
|
2,234,074
97.52% of 50 DAV
50 DAV is 2,291,000
|
$173.32
-0.01%
|
3/28/2019
|
$169.20
|
PP = $164.89
|
|
MB = $173.13
|
Most Recent Note - 4/15/2019 5:59:46 PM
Y - Posted a gain today with average volume for a new all-time high, yet it remains below the "max buy" level. Stubbornly holding its ground since a "breakaway gap" on 3/28/19 triggered a technical buy signal. Bullish action came after it reported Jan '19 earnings +39% on +26% sales revenues, marking its 5th consecutive quarterly comparison above the +25% minimum guideline (C criteria).
>>> FEATURED STOCK ARTICLE : Breakway Gap Backed by More Than 6 Times Average Volume - 3/28/2019 |
View all notes |
Set NEW NOTE alert |
Company Profile |
SEC
News |
Chart |
Request a new note
C
A
S
I |
NXST
-
NASDAQ
Nexstar Media Group Cl A
MEDIA - Broadcasting - TV
|
$115.30
|
-2.54
-2.16% |
$118.11
|
425,171
75.92% of 50 DAV
50 DAV is 560,000
|
$119.93
-3.86%
|
2/26/2019
|
$94.26
|
PP = $89.76
|
|
MB = $94.25
|
Most Recent Note - 4/18/2019 11:01:36 AM
G - Perched at its all-time high, very extended from any sound base. Disciplined investors avoid chasing stocks more than +5% above the prior high. Its 50 DMA line ($103) defines near-term support to watch on pullbacks.
>>> FEATURED STOCK ARTICLE : Hitting New High and Very Extended From Prior Base - 4/4/2019 |
View all notes |
Set NEW NOTE alert |
Company Profile |
SEC
News |
Chart |
Request a new note
C
A
S
I |
ULTA
-
NASDAQ
Ulta Beauty Inc
SPECIALTY RETAIL - Specialty Retail, Other
|
$350.88
|
-3.45
-0.97% |
$359.10
|
566,424
73.09% of 50 DAV
50 DAV is 775,000
|
$359.69
-2.45%
|
3/15/2019
|
$341.27
|
PP = $322.59
|
|
MB = $338.72
|
Most Recent Note - 4/18/2019 11:04:23 AM
G - Volume totals have been light while stubbornly holding its ground near its all-time high. Its 50 DMA line ($327) defines near term support above prior highs.
>>> FEATURED STOCK ARTICLE : Consolidating Following Big "Breakaway Gap" - 3/19/2019 |
View all notes |
Set NEW NOTE alert |
Company Profile |
SEC
News |
Chart |
Request a new note
C
A
S
I |
UBNT
-
NASDAQ
Ubiquiti Networks
TELECOMMUNICATIONS - Diversified Communication Serv
|
$167.75
|
+1.42
0.85% |
$168.87
|
412,176
103.82% of 50 DAV
50 DAV is 397,000
|
$172.80
-2.92%
|
2/8/2019
|
$121.97
|
PP = $115.54
|
|
MB = $121.32
|
Most Recent Note - 4/17/2019 5:39:55 PM
G - Reversed into the red for a loss today on higher volume after hitting another new all-time high, breaking a streak of 5 consecutive gains backed by average of lighter volume. Extended from any sound base after a big rally. Its prior high ($148.68 on 2/27/19) and its 50 DMA line ($145.87) define near-term support to watch. Fundamentals remain strong.
>>> FEATURED STOCK ARTICLE : Extended From Any Sound Bass and Wedging to New Highs - 4/12/2019 |
View all notes |
Set NEW NOTE alert |
Company Profile |
SEC
News |
Chart |
Request a new note
C
A
S
I |
Symbol/Exchange
Company Name
Industry Group |
PRICE |
CHANGE
(%Change) |
Day High |
Volume
(% DAV)
(% 50 day avg vol) |
52 Wk Hi
% From Hi |
Featured
Date |
Price
Featured |
Pivot Featured |
|
Max Buy |
ESNT
-
NYSE
Essent Group Ltd
Finance-MrtgandRel Svc
|
$45.09
|
-0.16
-0.35% |
$45.50
|
958,881
152.69% of 50 DAV
50 DAV is 628,000
|
$47.94
-5.94%
|
3/18/2019
|
$45.84
|
PP = $45.06
|
|
MB = $47.31
|
Most Recent Note - 4/16/2019 1:17:58 PM
Y - Found support above its 50 DMA line ($43.97) reassuringly on the recent pullback. Still faces some resistance due to overhead supply up to the $50 level. Fundamentals are strong.
>>> FEATURED STOCK ARTICLE : Big Breakout Gain With +350% Above Average Volume - 3/18/2019 |
View all notes |
Set NEW NOTE alert |
Company Profile |
SEC
News |
Chart |
Request a new note
C
A
S
I |
FIVE
-
NASDAQ
Five Below Inc
Retail-DiscountandVariety
|
$141.65
|
+1.91
1.37% |
$141.88
|
1,072,692
101.58% of 50 DAV
50 DAV is 1,056,000
|
$139.97
1.20%
|
4/11/2019
|
$132.05
|
PP = $133.75
|
|
MB = $140.44
|
Most Recent Note - 4/17/2019 5:47:13 PM
Y - Hit yet another new all-time high approaching its "max buy" level with today's 6th consecutive gain, however, the recent gains have lacked great volume conviction. Gains above the pivot point must have at least +40% above average volume to clinch a proper technical buy signal.
>>> FEATURED STOCK ARTICLE : Finished Strong After Featured Again in Mid-Day Report - 4/11/2019 |
View all notes |
Set NEW NOTE alert |
Company Profile |
SEC
News |
Chart |
Request a new note
C
A
S
I |
NOW
-
NYSE
Servicenow Inc
Computer Sftwr-Enterprse
|
$237.40
|
+1.17
0.50% |
$238.92
|
2,934,081
171.48% of 50 DAV
50 DAV is 1,711,000
|
$251.65
-5.66%
|
1/31/2019
|
$218.14
|
PP = $206.40
|
|
MB = $216.72
|
Most Recent Note - 4/18/2019 12:48:19 PM
G - Slumped below its 50 DMA line ($238) on the prior session with a volume-driven loss raising concerns. A prompt rebound above the 50 DMA line is needed for its outlook to improve. Prior lows ($230.14 on 4/04/19 and $226.71 on 3/08/19) define near-term support to watch. More damaging losses would raise concerns and trigger technical sell signals.
>>> FEATURED STOCK ARTICLE : Found Recent Support at 50-Day Moving Average - 4/15/2019 |
View all notes |
Set NEW NOTE alert |
Company Profile |
SEC
News |
Chart |
Request a new note
C
A
S
I |
PANW
-
NYSE
Palo Alto Networks
Computer Sftwr-Security
|
$235.46
|
-3.97
-1.66% |
$238.43
|
1,051,055
76.72% of 50 DAV
50 DAV is 1,370,000
|
$260.63
-9.66%
|
2/25/2019
|
$233.54
|
PP = $239.60
|
|
MB = $251.58
|
Most Recent Note - 4/17/2019 5:45:13 PM
Y - Volume was higher behind today's big loss nearly testing its 50 DMA line ($237.51) which defines important support to watch above the prior low ($233.15 on 4/04/19). Fundamentals remain strong.
>>> FEATURED STOCK ARTICLE : Consolidating Above Prior High and 50-Day Average - 4/3/2019 |
View all notes |
Set NEW NOTE alert |
Company Profile |
SEC
News |
Chart |
Request a new note
C
A
S
I |
ANET
-
NYSE
Arista Networks Inc
TELECOMMUNICATIONS - Communication Equipment
|
$323.38
|
-4.66
-1.42% |
$329.34
|
767,618
87.63% of 50 DAV
50 DAV is 876,000
|
$331.27
-2.38%
|
3/13/2019
|
$295.38
|
PP = $313.37
|
|
MB = $329.04
|
Most Recent Note - 4/15/2019 5:55:26 PM
Y - Hit a new high today with a small gain on lighter than average volume. It rebounded above its pivot point but remains below the "max buy" level previously noted.
>>> FEATURED STOCK ARTICLE : Rebounding Near High After Deep Consolidation - 3/13/2019 |
View all notes |
Set NEW NOTE alert |
Company Profile |
SEC
News |
Chart |
Request a new note
C
A
S
I |
Symbol/Exchange
Company Name
Industry Group |
PRICE |
CHANGE
(%Change) |
Day High |
Volume
(% DAV)
(% 50 day avg vol) |
52 Wk Hi
% From Hi |
Featured
Date |
Price
Featured |
Pivot Featured |
|
Max Buy |
PAYC
-
NYSE
Paycom Software Inc
COMPUTER SOFTWARE and SERVICES - Application Software
|
$188.95
|
+2.01
1.08% |
$190.13
|
791,105
123.61% of 50 DAV
50 DAV is 640,000
|
$193.75
-2.48%
|
2/6/2019
|
$171.66
|
PP = $164.18
|
|
MB = $172.39
|
Most Recent Note - 4/16/2019 5:37:51 PM
G - It has not formed a sound new base of sufficient length but volume totals have been cooling while stubbornly holding its ground. Its 50 DMA line ($181.41) defines important near-term support to watch above prior lows. See the latest FSU analysis for more details and a new annotated graph.
>>> FEATURED STOCK ARTICLE : Paycom Software Quietly Hovering Near All-Time High - 4/16/2019 |
View all notes |
Set NEW NOTE alert |
Company Profile |
SEC
News |
Chart |
Request a new note
C
A
S
I |
PYPL
-
NASDAQ
Paypal Holdings Inc
Finance-CrdtCard/PmtPr
|
$107.36
|
-1.45
-1.33% |
$108.45
|
9,972,563
154.81% of 50 DAV
50 DAV is 6,442,000
|
$109.00
-1.50%
|
1/24/2019
|
$92.56
|
PP = $93.80
|
|
MB = $98.49
|
Most Recent Note - 4/18/2019 12:50:56 PM
G - Pulling back from its all-time high with today's loss on higher volume. Very extended from any sound base after gains lacking great volume conviction in recent weeks. Well above its 50 DMA line ($100.32) which defines support to watch.
>>> FEATURED STOCK ARTICLE : Extended From Base After Gains in Recent Weeks Lacking Volume - 4/2/2019 |
View all notes |
Set NEW NOTE alert |
Company Profile |
SEC
News |
Chart |
Request a new note
C
A
S
I |
ALRM
-
NASDAQ
Alarm.com Holdings Inc
Security/Sfty
|
$67.13
|
-0.46
-0.68% |
$67.82
|
233,984
50.10% of 50 DAV
50 DAV is 467,000
|
$69.61
-3.56%
|
1/22/2019
|
$60.52
|
PP = $60.30
|
|
MB = $63.32
|
Most Recent Note - 4/18/2019 10:54:06 AM
G - Pulling back today for a 3rd consecutive loss after wedging to new highs with a streak of gains lacking great volume conviction. Found prompt support near the 50 DMA line after it reported earnings +12% on +25% sales revenues for the Dec '18 quarter, below the +25% minimum earnings guideline (C criteria), raising fundamental concerns.
>>> FEATURED STOCK ARTICLE : Consolidating Near 50-Day Average Following Sub Par Report - 3/29/2019 |
View all notes |
Set NEW NOTE alert |
Company Profile |
SEC
News |
Chart |
Request a new note
C
A
S
I |
PLNT
-
NYSE
Planet Fitness Inc Cl A
Leisure-Services
|
$73.41
|
+0.52
0.71% |
$74.34
|
773,481
55.49% of 50 DAV
50 DAV is 1,394,000
|
$74.60
-1.60%
|
11/7/2018
|
$57.10
|
PP = $55.45
|
|
MB = $58.22
|
Most Recent Note - 4/18/2019 11:02:36 AM
G - Holding its ground near its all-time high, very extended from any sound base. Its 50 DMA line (65.22) defines near-term support above prior highs in the $59-60 area. Fundamentals remain strong.
>>> FEATURED STOCK ARTICLE : Perched Near High Very Extended From Prior Base - 4/5/2019 |
View all notes |
Set NEW NOTE alert |
Company Profile |
SEC
News |
Chart |
Request a new note
C
A
S
I |
TEAM
-
NASDAQ
Atlassian Corp Plc Cl A
Comp Sftwr-Spec Enterprs
|
$101.94
|
-9.25
-8.32% |
$105.60
|
7,424,928
504.07% of 50 DAV
50 DAV is 1,473,000
|
$117.06
-12.92%
|
4/16/2019
|
$114.77
|
PP = $116.80
|
|
MB = $122.64
|
Most Recent Note - 4/18/2019 12:51:56 PM
G - Color code was changed to green after violating its 50 DMA line ($108.78) with a gap down and big volume-driven loss today. Reported earnings +133% on +38% sales revenues for the Mar '19 quarter, continuing its strong earnings track record. Volume and volatility often increase near earnings news. Fundamentals remain strong.
>>> FEATURED STOCK ARTICLE : Perched Near High Enduring Distributional Pressure - 4/9/2019 |
View all notes |
Set NEW NOTE alert |
Company Profile |
SEC
News |
Chart |
Request a new note
C
A
S
I |
Symbol/Exchange
Company Name
Industry Group |
PRICE |
CHANGE
(%Change) |
Day High |
Volume
(% DAV)
(% 50 day avg vol) |
52 Wk Hi
% From Hi |
Featured
Date |
Price
Featured |
Pivot Featured |
|
Max Buy |
GLOB
-
NYSE
Globant SA
Computer-Tech Services
|
$78.60
|
+0.23
0.29% |
$79.78
|
193,497
95.32% of 50 DAV
50 DAV is 203,000
|
$82.93
-5.23%
|
2/15/2019
|
$69.35
|
PP = $70.00
|
|
MB = $73.50
|
Most Recent Note - 4/17/2019 5:33:42 PM
G - Retreated from its all-time high with today's big loss with near average volume. Near-term support is at its prior high ($74) and its 50 DMA line ($71.69) . Violations would raise concerns and trigger technical sell signals.
>>> FEATURED STOCK ARTICLE : Consolidating Near 50-Day Average Quietly Perched Near High - 3/26/2019 |
View all notes |
Set NEW NOTE alert |
Company Profile |
SEC
News |
Chart |
Request a new note
C
A
S
I |
TTD
-
NASDAQ
The Trade Desk Inc Cl A
Comml Svcs-Advertising
|
$198.74
|
-0.05
-0.03% |
$199.91
|
708,197
43.39% of 50 DAV
50 DAV is 1,632,000
|
$214.70
-7.43%
|
2/6/2019
|
$148.65
|
PP = $149.00
|
|
MB = $156.45
|
Most Recent Note - 4/16/2019 1:43:26 PM
G - Volume totals have been cooling while consolidating in an orderly fashion above its 50 DMA line ($187.53) which defines initial support to watch above the prior low ($178.30 on 3/27/19).
>>> FEATURED STOCK ARTICLE : Hit Another New All-Time High Getting Extended From Prior Base - 3/21/2019 |
View all notes |
Set NEW NOTE alert |
Company Profile |
SEC
News |
Chart |
Request a new note
C
A
S
I |