You are not logged in.
This means you
CAN ONLY VIEW reports that were published prior to Sunday, February 25, 2024.
You
MUST UPGRADE YOUR MEMBERSHIP if you want to see any current reports.
AFTER MARKET UPDATE - FRIDAY, APRIL 17TH, 2020
Previous After Market Report Next After Market Report >>>
|
|
|
|
DOW |
+704.81 |
24,242.49 |
+2.99% |
|
Volume |
1,389,209,977 |
+25% |
|
Volume |
4,319,337,900 |
+8% |
|
NASDAQ |
+117.78 |
8,650.14 |
+1.38% |
|
Advancers |
2,470 |
85% |
|
Advancers |
2,608 |
80% |
|
S&P 500 |
+75.01 |
2,874.56 |
+2.68% |
|
Decliners |
427 |
15% |
|
Decliners |
663 |
20% |
|
Russell 2000 |
+51.01 |
1,229.10 |
+4.33% |
|
52 Wk Highs |
19 |
|
|
52 Wk Highs |
41 |
|
|
S&P 600 |
+31.16 |
722.58 |
+4.51% |
|
52 Wk Lows |
10 |
|
|
52 Wk Lows |
13 |
|
|
 |
Breadth Positive and Volume Higher as Major Indices Rise
Kenneth J. Gruneisen - Passed the CAN SLIM® Master's Exam
The Dow added 704 points, ending the week up 2.2%. The S&P 500 climbed 2.7% to cap a 3% weekly advance, its first back-to-back week of gains since mid-February. The Nasdaq Composite was up 1.4%, ending the week 6.1% higher and trimming its year-to-date decline to 3.6%. Breadth was positive as advancers led decliners by almost a 6-1 margin on the NYSE and by nearly 4-1 on the Nasdaq exchange. The reported volume totals were higher than the prior session totals on the NYSE and on the Nasdaq exchange, indicating an increase in institutional buying demand. Leadership waned as 23 high-ranked companies from the Leaders List hit new 52-week highs and were listed on the BreakOuts Page, versus 29 on the prior session. New 52-week highs outnumbered the new 52-week lows on the NYSE and on the Nasdaq exchange. The major indices (M criteria) are in a new confirmed uptrend. Any sustainable rally requires a healthy crop of new leaders, so it is important to see continued improvement in this area. Charts used courtesy of www.stockcharts.com
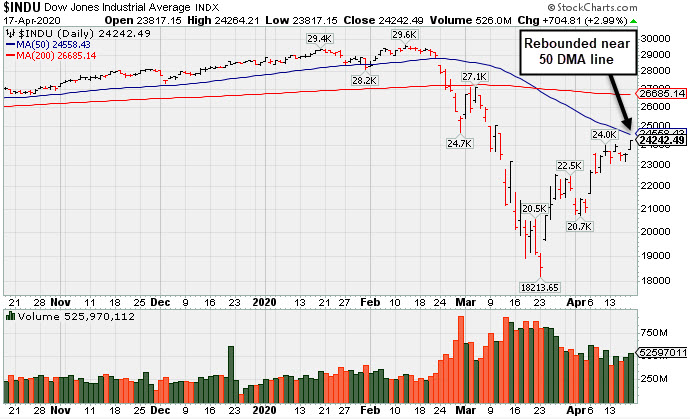
PICTURED: The Dow Jones Industrial Average has rebounded near its 50-day moving average (DMA) line. The follow-through day of big confirming gains on Monday, April 6th from the major indices on higher volume, coupled with an increase in the number of stocks hitting new highs, signaled a valid new market uptrend (M criteria).
Stocks finished higher on Friday amid promising developments surrounding a potential coronavirus treatment. Garnering the bulk of headlines was biotech company Gilead Sciences (GILD +9.73%) rose on evidence that its experimental drug proved effective in treating late-stage COVID-19 patients. Further bolstering sentiment were new federal guidelines, which outlined a three-phase re-opening plan for the U.S. economy. Deferring to individual governors, President Trump announced that as many as 29 states that have observed relatively few cases of the virus could begin lifting lockdown restrictions.
All 11 S&P 500 sectors closed in positive territory, with Energy logging a double-digit gain despite another drop in oil prices. In earnings, Procter & Gamble (PG +2.60%) after the consumer products giant delivered a 6% increase in organic sales. In other corporate news, Boeing (BA +14.55%) on reports the jet maker would restart limited production in Seattle.
On the data front, the Index of Leading Economic Indicators slumped 6.7% in March, better than expected, but deteriorating from a 0.2% dip in the prior month. Overseas, data from China showed the world’s second-largest economy shrank 6.8% in the first quarter, the worst contraction on record. Treasuries weakened despite the downbeat data, with the yield on the 10-year note up four basis points to 0.65%. |
 Kenneth J. Gruneisen started out as a licensed stockbroker in August 1987, a couple of months prior to the historic stock market crash that took the Dow Jones Industrial Average down -22.6% in a single day. He has published daily fact-based fundamental and technical analysis on high-ranked stocks online for two decades. Through FACTBASEDINVESTING.COM, Kenneth provides educational articles, news, market commentary, and other information regarding proven investment systems that work in good times and bad.
Comments contained in the body of this report are technical opinions only and are not necessarily those of Gruneisen Growth Corp. The material herein has been obtained from sources believed to be reliable and accurate, however, its accuracy and completeness cannot be guaranteed. Our firm, employees, and customers may effect transactions, including transactions contrary to any recommendation herein, or have positions in the securities mentioned herein or options with respect thereto. Any recommendation contained in this report may not be suitable for all investors and it is not to be deemed an offer or solicitation on our part with respect to the purchase or sale of any securities. |
|
 |
Energy Group Led as Financial, Tech, and Retail Indexes Rose
Kenneth J. Gruneisen - Passed the CAN SLIM® Master's Exam
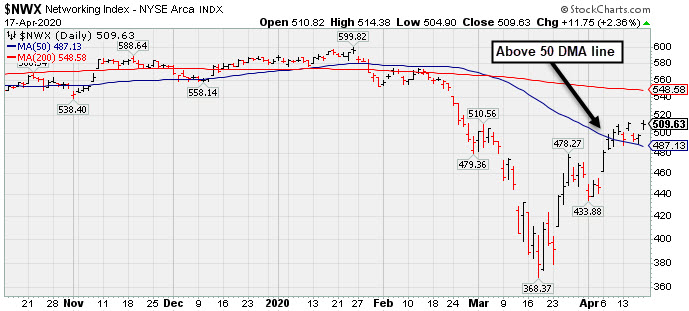
Energy-linked groups were standout gainers as the Oil Services Index ($OSX +7.67%) and the Integrated Oil Index ($XOI +10.45%) both rallied considerably. The financials were led higher by the Bank Index ($BKX +8.40%) while the Broker/Dealer Index ($XBD +2.67%) followed. The Retail Index ($RLX +1.00%) posted a smaller gain. The Biotech Index ($BTK +4.43%) led the tech sector higher while the Networking Index ($NWX +2.36%) followed and the Semiconductor Index ($SOX +0.87%) posted a smaller gain. The Gold & Silver Index ($XAU -1.74%) was a laggard as it lost ground. PICTURED: The Networking Index ($NWX +2.36%) has rebounded above its 50-day moving average (DMA) line from its March 2020 low.
| Oil Services |
$OSX |
26.15 |
+1.86 |
+7.66% |
-66.60% |
| Integrated Oil |
$XOI |
686.65 |
+64.99 |
+10.45% |
-45.96% |
| Semiconductor |
$SOX |
1,705.64 |
+14.77 |
+0.87% |
-7.78% |
| Networking |
$NWX |
509.63 |
+11.75 |
+2.36% |
-12.65% |
| Broker/Dealer |
$XBD |
231.74 |
+6.03 |
+2.67% |
-20.19% |
| Retail |
$RLX |
2,581.89 |
+25.49 |
+1.00% |
+5.41% |
| Gold & Silver |
$XAU |
104.28 |
-1.85 |
-1.74% |
-2.47% |
| Bank |
$BKX |
70.00 |
+5.43 |
+8.41% |
-38.25% |
| Biotech |
$BTK |
5,184.04 |
+220.07 |
+4.43% |
+2.30% |
|
|
|
 |
Featured Stocks
Kenneth J. Gruneisen - Passed the CAN SLIM® Master's Exam
As leadership improves the number of stocks covered in this area should be expected to increase gradually, as superior candidates are added to the Featured Stocks list on a case-by-case basis. Feel free to contact us if you have a need for any additional information. |
|
|
Color Codes Explained :
Y - Better candidates highlighted by our
staff of experts.
G - Previously featured
in past reports as yellow but may no longer be buyable under the
guidelines.
***Last / Change / Volume data in this table is the closing quote data***
|
|
|
THESE ARE NOT BUY RECOMMENDATIONS!
Comments contained in the body of this report are technical
opinions only. The material herein has been obtained
from sources believed to be reliable and accurate, however,
its accuracy and completeness cannot be guaranteed.
This site is not an investment advisor, hence it does
not endorse or recommend any securities or other investments.
Any recommendation contained in this report may not
be suitable for all investors and it is not to be deemed
an offer or solicitation on our part with respect to
the purchase or sale of any securities. All trademarks,
service marks and trade names appearing in this report
are the property of their respective owners, and are
likewise used for identification purposes only.
This report is a service available
only to active Paid Premium Members.
You may opt-out of receiving report notifications
at any time. Questions or comments may be submitted
by writing to Premium Membership Services 665 S.E. 10 Street, Suite 201 Deerfield Beach, FL 33441-5634 or by calling 1-800-965-8307
or 954-785-1121.
|
|
|