***Last / Change / Volume data in this table is the closing quote data***
Symbol/Exchange
Company Name
Industry Group |
PRICE |
CHANGE
(%Change) |
Day High |
Volume
(% DAV)
(% 50 day avg vol) |
52 Wk Hi
% From Hi |
Featured
Date |
Price
Featured |
Pivot Featured |
|
Max Buy |
MLR
-
NYSE
Miller Industries Inc
AUTOMOTIVE - Auto Parts
|
$32.56
|
-0.22
-0.67% |
$33.33
|
17,225
44.17% of 50 DAV
50 DAV is 39,000
|
$35.26
-7.66%
|
11/30/2018
|
$28.35
|
PP = $29.50
|
|
MB = $30.98
|
 Most Recent Note - 4/15/2019 6:00:32 PM
G - Consolidating above its 50 DMA line ($32.15). Prior highs in the $29 area define the next near-term support to watch. Reported earnings +17% on +13% sales revenues for the Dec '18 quarter, below the +25% minimum guideline (C criteria), raising fundamental concerns, and it has endured mild distributional pressure in recent weeks.
>>> FEATURED STOCK ARTICLE : Below 50-Day Average After Damaging Losses - 4/8/2019 |
View all notes |
Set NEW NOTE alert |
Company Profile |
SEC
News |
Chart |
Request a new note
C
A
S
I |
NSP
-
NYSE
Insperity Inc
Comml Svcs-Outsourcing
|
$128.86
|
-0.53
-0.41% |
$129.88
|
199,842
54.45% of 50 DAV
50 DAV is 367,000
|
$132.50
-2.75%
|
2/11/2019
|
$127.91
|
PP = $121.25
|
|
MB = $127.31
|
Most Recent Note - 4/9/2019 3:54:12 PM
Y - Color code is changed to yellow while quietly pulling back bellow its "max buy" level again. Found support while consolidating above its 50 DMA line ($122.26) and near prior highs in the $119-121 area which define important near-term support to watch.
>>> FEATURED STOCK ARTICLE : Volume Totals Cooling and Consolidating Near Prior Highs - 3/14/2019 |
View all notes |
Set NEW NOTE alert |
Company Profile |
SEC
News |
Chart |
Request a new note
C
A
S
I |
ZBRA
-
NASDAQ
Zebra Tech Corp Cl A
COMPUTER HARDWARE - Computer Peripherals
|
$231.28
|
-2.46
-1.05% |
$234.53
|
591,739
128.92% of 50 DAV
50 DAV is 459,000
|
$234.00
-1.16%
|
2/14/2019
|
$198.10
|
PP = $184.85
|
|
MB = $194.09
|
Most Recent Note - 4/12/2019 12:44:24 PM
G - Hitting another new all-time high today, getting very extended from any sound base. Its 50 DMA line ($203.86) defines near-term support to watch on pullbacks.
>>> FEATURED STOCK ARTICLE : Zebra Extended From Prior Base - 3/25/2019 |
View all notes |
Set NEW NOTE alert |
Company Profile |
SEC
News |
Chart |
Request a new note
C
A
S
I |
FTNT
-
NASDAQ
Fortinet Inc
Computer Sftwr-Security
|
$95.22
|
+2.51
2.71% |
$95.59
|
2,500,047
139.12% of 50 DAV
50 DAV is 1,797,000
|
$94.37
0.90%
|
4/10/2019
|
$89.76
|
PP = $88.70
|
|
MB = $93.14
|
Most Recent Note - 4/15/2019 12:32:42 PM
G - Color code is changed to green after rising above its "max buy" level and hitting a new all-time high with today's 7th consecutive gain. Prior highs in the $88 area define near-term support to watch on pullbacks.
>>> FEATURED STOCK ARTICLE : Volume-Driven Gain Cleared Flat Base and Little Resistance Remains - 4/10/2019 |
View all notes |
Set NEW NOTE alert |
Company Profile |
SEC
News |
Chart |
Request a new note
C
A
S
I |
SPSC
-
NASDAQ
S P S Commerce Inc
COMPUTER SOFTWARE and SERVICES - Application Software
|
$103.50
|
-0.77
-0.74% |
$106.06
|
88,354
54.88% of 50 DAV
50 DAV is 161,000
|
$113.31
-8.66%
|
3/26/2019
|
$107.12
|
PP = $113.41
|
|
MB = $119.08
|
Most Recent Note - 4/9/2019 3:50:45 PM
Y - Found prompt support today near prior highs and its 50 DMA line ($102.99). Subsequent gains above the pivot point backed by at least +40% above average volume may trigger a new (or add-on) technical buy signal.
>>> FEATURED STOCK ARTICLE : Consolidating in Orderly Fashion Above Prior Highs - 3/22/2019 |
View all notes |
Set NEW NOTE alert |
Company Profile |
SEC
News |
Chart |
Request a new note
C
A
S
I |
Symbol/Exchange
Company Name
Industry Group |
PRICE |
CHANGE
(%Change) |
Day High |
Volume
(% DAV)
(% 50 day avg vol) |
52 Wk Hi
% From Hi |
Featured
Date |
Price
Featured |
Pivot Featured |
|
Max Buy |
SSNC
-
NASDAQ
S S & C Technologies
COMPUTER SOFTWARE and SERVICES - Application Software
|
$65.34
|
+0.05
0.08% |
$65.98
|
728,002
41.84% of 50 DAV
50 DAV is 1,740,000
|
$66.30
-1.45%
|
2/15/2019
|
$59.73
|
PP = $61.07
|
|
MB = $64.12
|
Most Recent Note - 4/10/2019 5:11:01 PM
G - Color code is changed to green after rising above its "max buy" level today and ending near its all-time high. Its 50 DMA line ($60) and prior low define near term support to watch.
>>> FEATURED STOCK ARTICLE : Hovering Near High With Volume Totals Cooling in Recent Weeks - 3/27/2019 |
View all notes |
Set NEW NOTE alert |
Company Profile |
SEC
News |
Chart |
Request a new note
C
A
S
I |
IRBT
-
NASDAQ
Irobot Corp
CONSUMER DURABLES - Electronic Equipment
|
$127.53
|
-0.51
-0.40% |
$130.10
|
489,213
57.96% of 50 DAV
50 DAV is 844,000
|
$132.88
-4.03%
|
2/8/2019
|
$104.92
|
PP = $103.63
|
|
MB = $108.81
|
Most Recent Note - 4/9/2019 3:56:33 PM
G - Perched within striking distance of its all-time high with volume totals cooling. Its 50 DMA line ($116.28) and recent low ($114.40 on 3/27/19) define important near-term support while building a new base.
>>> FEATURED STOCK ARTICLE : Consolidating After Getting Extended from Double Bottom Base - 3/12/2019 |
View all notes |
Set NEW NOTE alert |
Company Profile |
SEC
News |
Chart |
Request a new note
C
A
S
I |
AUDC
-
NASDAQ
Audiocodes Ltd
ELECTRONICS - Scientific and Technical Instrum
|
$15.81
|
+0.14
0.89% |
$15.81
|
129,502
64.75% of 50 DAV
50 DAV is 200,000
|
$16.36
-3.33%
|
3/20/2019
|
$13.66
|
PP = $15.06
|
|
MB = $15.81
|
Most Recent Note - 4/11/2019 5:13:56 PM
Y - Pulled back with light volume and its color code is changed to yellow after retreating below its "max buy" level. Prior high ($14.96) defines initial support to watch above its 50 DMA line ($13.86).
>>> FEATURED STOCK ARTICLE : Building a Base and Found Support Near 50-Day Moving Average - 3/20/2019 |
View all notes |
Set NEW NOTE alert |
Company Profile |
SEC
News |
Chart |
Request a new note
C
A
S
I |
ENV
-
NYSE
Envestnet Inc
FINANCIAL SERVICES - Diversified Investments
|
$68.77
|
-0.05
-0.07% |
$69.19
|
170,150
57.68% of 50 DAV
50 DAV is 295,000
|
$69.32
-0.79%
|
3/15/2019
|
$66.05
|
PP = $64.90
|
|
MB = $68.15
|
Most Recent Note - 4/11/2019 1:46:48 PM
G - Color code is changed to green after rallying above its "max buy" level today and hitting a new all-time high. The recent low ($63.34 on 3/27/19) and 50 DMA line define near-term support to watch on pullbacks.
>>> FEATURED STOCK ARTICLE : Volume Heavy Behind Rally to New Highs - 3/15/2019 |
View all notes |
Set NEW NOTE alert |
Company Profile |
SEC
News |
Chart |
Request a new note
C
A
S
I |
LHCG
-
NASDAQ
L H C Group Inc
HEALTH SERVICES - Home Health Care
|
$108.28
|
+1.85
1.74% |
$108.77
|
273,918
110.01% of 50 DAV
50 DAV is 249,000
|
$115.54
-6.28%
|
1/23/2019
|
$107.29
|
PP = $107.61
|
|
MB = $112.99
|
Most Recent Note - 4/12/2019 12:26:22 PM
G - Slump below its 50 DMA line raised concerns. A prompt rebound above the 50 DMA line ($109.65) is needed for its outlook to improve. Prior low ($106.04 on 3/28/19) defines the next important near-term support above its 200 DMA line ($98.86).
>>> FEATURED STOCK ARTICLE : Sputtering Near 50-Day Moving Average Line - 4/1/2019 |
View all notes |
Set NEW NOTE alert |
Company Profile |
SEC
News |
Chart |
Request a new note
C
A
S
I |
Symbol/Exchange
Company Name
Industry Group |
PRICE |
CHANGE
(%Change) |
Day High |
Volume
(% DAV)
(% 50 day avg vol) |
52 Wk Hi
% From Hi |
Featured
Date |
Price
Featured |
Pivot Featured |
|
Max Buy |
ENSG
-
NASDAQ
Ensign Group Inc
HEALTH SERVICES - Long-Term Care Facilities
|
$51.78
|
+0.02
0.04% |
$52.49
|
183,529
56.30% of 50 DAV
50 DAV is 326,000
|
$54.56
-5.10%
|
2/7/2019
|
$48.71
|
PP = $49.06
|
|
MB = $51.51
|
Most Recent Note - 4/15/2019 5:58:03 PM
G - Color code is changed to green while above the previously noted "max buy" level. Near term support is at its 50 DMA line ($50.15) and prior lows in the $47 area and above
>>> FEATURED STOCK ARTICLE : Consolidating Near Proir High and Above 50-Day Average - 3/11/2019 |
View all notes |
Set NEW NOTE alert |
Company Profile |
SEC
News |
Chart |
Request a new note
C
A
S
I |
LULU
-
NASDAQ
Lululemon Athletica
MANUFACTURING - Textile Manufacturing
|
$172.01
|
+2.13
1.25% |
$173.07
|
2,391,151
104.69% of 50 DAV
50 DAV is 2,284,000
|
$172.90
-0.51%
|
3/28/2019
|
$169.20
|
PP = $164.89
|
|
MB = $173.13
|
Most Recent Note - 4/15/2019 5:59:46 PM
Y - Posted a gain today with average volume for a new all-time high, yet it remains below the "max buy" level. Stubbornly holding its ground since a "breakaway gap" on 3/28/19 triggered a technical buy signal. Bullish action came after it reported Jan '19 earnings +39% on +26% sales revenues, marking its 5th consecutive quarterly comparison above the +25% minimum guideline (C criteria).
>>> FEATURED STOCK ARTICLE : Breakway Gap Backed by More Than 6 Times Average Volume - 3/28/2019 |
View all notes |
Set NEW NOTE alert |
Company Profile |
SEC
News |
Chart |
Request a new note
C
A
S
I |
NXST
-
NASDAQ
Nexstar Media Group Cl A
MEDIA - Broadcasting - TV
|
$116.83
|
+1.02
0.88% |
$117.00
|
281,811
50.78% of 50 DAV
50 DAV is 555,000
|
$116.15
0.59%
|
2/26/2019
|
$94.26
|
PP = $89.76
|
|
MB = $94.25
|
Most Recent Note - 4/11/2019 1:37:08 PM
G - Perched at its all-time high, very extended from any sound base. Disciplined investors avoid chasing stocks more than +5% above the prior high. Its 50 DMA line ($100) defines near-term support to watch on pullbacks.
>>> FEATURED STOCK ARTICLE : Hitting New High and Very Extended From Prior Base - 4/4/2019 |
View all notes |
Set NEW NOTE alert |
Company Profile |
SEC
News |
Chart |
Request a new note
C
A
S
I |
ULTA
-
NASDAQ
Ulta Beauty Inc
SPECIALTY RETAIL - Specialty Retail, Other
|
$353.94
|
+9.11
2.64% |
$354.67
|
677,962
86.59% of 50 DAV
50 DAV is 783,000
|
$355.73
-0.50%
|
3/15/2019
|
$341.27
|
PP = $322.59
|
|
MB = $338.72
|
Most Recent Note - 4/11/2019 1:44:07 PM
G - Volume totals have been cooling while stubbornly holding its ground near its all-time high after rallying above its "max buy" level. Bullish action came after it reported earnings +31% sales revenues on +10% sales revenues for the Jan '19 quarter.
>>> FEATURED STOCK ARTICLE : Consolidating Following Big "Breakaway Gap" - 3/19/2019 |
View all notes |
Set NEW NOTE alert |
Company Profile |
SEC
News |
Chart |
Request a new note
C
A
S
I |
UBNT
-
NASDAQ
Ubiquiti Networks
TELECOMMUNICATIONS - Diversified Communication Serv
|
$167.91
|
+2.14
1.29% |
$168.41
|
392,857
101.25% of 50 DAV
50 DAV is 388,000
|
$166.64
0.77%
|
2/8/2019
|
$121.97
|
PP = $115.54
|
|
MB = $121.32
|
Most Recent Note - 4/12/2019 5:01:45 PM
G - Hit a new all-time high with today's 3rd consecutive gain backed by lighter volume. Extended from any sound base, but held its ground stubbornly after a big rally. Its 50 DMA line ($142) and prior low ($136.08 on 3/08/19) define near-term support to watch on pullbacks. Fundamentals remain strong. See the latest FSU analysis for more details and a new annotated graph.
>>> FEATURED STOCK ARTICLE : Extended From Any Sound Bass and Wedging to New Highs - 4/12/2019 |
View all notes |
Set NEW NOTE alert |
Company Profile |
SEC
News |
Chart |
Request a new note
C
A
S
I |
Symbol/Exchange
Company Name
Industry Group |
PRICE |
CHANGE
(%Change) |
Day High |
Volume
(% DAV)
(% 50 day avg vol) |
52 Wk Hi
% From Hi |
Featured
Date |
Price
Featured |
Pivot Featured |
|
Max Buy |
ESNT
-
NYSE
Essent Group Ltd
Finance-MrtgandRel Svc
|
$45.63
|
-0.27
-0.59% |
$46.38
|
450,546
71.06% of 50 DAV
50 DAV is 634,000
|
$47.94
-4.82%
|
3/18/2019
|
$45.84
|
PP = $45.06
|
|
MB = $47.31
|
Most Recent Note - 4/9/2019 3:46:32 PM
Y - Abruptly retreating today after 6 consecutive gains lacking great volume conviction. Found support above its 50 DMA line ($43.39) reassuringly on the recent pullback. Still faces some resistance due to overhead supply up to the $50 level. Fundamentals are strong.
>>> FEATURED STOCK ARTICLE : Big Breakout Gain With +350% Above Average Volume - 3/18/2019 |
View all notes |
Set NEW NOTE alert |
Company Profile |
SEC
News |
Chart |
Request a new note
C
A
S
I |
FIVE
-
NASDAQ
Five Below Inc
Retail-DiscountandVariety
|
$135.64
|
+0.67
0.50% |
$136.36
|
1,184,579
115.23% of 50 DAV
50 DAV is 1,028,000
|
$136.13
-0.36%
|
4/11/2019
|
$132.05
|
PP = $133.75
|
|
MB = $140.44
|
Most Recent Note - 4/15/2019 12:28:49 PM
Y - Perched near its all-time high following a spurt of gains marked by above average volume. Subsequent gains with at least +40% above average volume and a strong close above the pivot point may clinch a technical buy signal.
>>> FEATURED STOCK ARTICLE : Finished Strong After Featured Again in Mid-Day Report - 4/11/2019 |
View all notes |
Set NEW NOTE alert |
Company Profile |
SEC
News |
Chart |
Request a new note
C
A
S
I |
NOW
-
NYSE
Servicenow Inc
Computer Sftwr-Enterprse
|
$243.79
|
-0.51
-0.21% |
$246.40
|
1,295,652
72.22% of 50 DAV
50 DAV is 1,794,000
|
$251.65
-3.12%
|
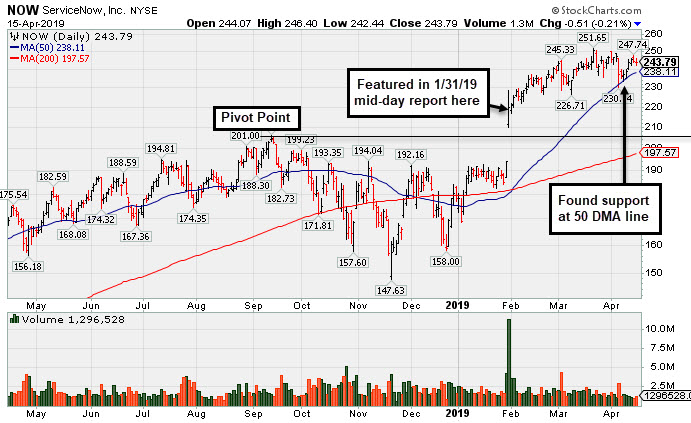
1/31/2019
|
$218.14
|
PP = $206.40
|
|
MB = $216.72
|
Most Recent Note - 4/15/2019 6:01:47 PM
G - Extended from any sound base, finding support at its 50 DMA line ($238) recently. Below that important short-term average the recent low ($226.71 on 3/08/19) defines near-term support to watch. More damaging losses would raise concerns and trigger technical sell signals. See the latest FSU analysis for more details and a new annotated graph.
>>> FEATURED STOCK ARTICLE : Found Recent Support at 50-Day Moving Average - 4/15/2019 |
View all notes |
Set NEW NOTE alert |
Company Profile |
SEC
News |
Chart |
Request a new note
C
A
S
I |
PANW
-
NYSE
Palo Alto Networks
Computer Sftwr-Security
|
$248.22
|
+3.56
1.46% |
$248.65
|
954,958
69.50% of 50 DAV
50 DAV is 1,374,000
|
$260.63
-4.76%
|
2/25/2019
|
$233.54
|
PP = $239.60
|
|
MB = $251.58
|
Most Recent Note - 4/9/2019 3:59:18 PM
Y - Volume totals have been cooling while consolidating above its 50 DMA line ($234) defining important support to watch above the prior low ($230.36 on 3/08/19). Fundamentals remain strong.
>>> FEATURED STOCK ARTICLE : Consolidating Above Prior High and 50-Day Average - 4/3/2019 |
View all notes |
Set NEW NOTE alert |
Company Profile |
SEC
News |
Chart |
Request a new note
C
A
S
I |
ANET
-
NYSE
Arista Networks Inc
TELECOMMUNICATIONS - Communication Equipment
|
$327.34
|
+2.57
0.79% |
$329.25
|
540,024
61.16% of 50 DAV
50 DAV is 883,000
|
$326.50
0.26%
|
3/13/2019
|
$295.38
|
PP = $313.37
|
|
MB = $329.04
|
Most Recent Note - 4/15/2019 5:55:26 PM
Y - Hit a new high today with a small gain on lighter than average volume. It rebounded above its pivot point but remains below the "max buy" level previously noted.
>>> FEATURED STOCK ARTICLE : Rebounding Near High After Deep Consolidation - 3/13/2019 |
View all notes |
Set NEW NOTE alert |
Company Profile |
SEC
News |
Chart |
Request a new note
C
A
S
I |
Symbol/Exchange
Company Name
Industry Group |
PRICE |
CHANGE
(%Change) |
Day High |
Volume
(% DAV)
(% 50 day avg vol) |
52 Wk Hi
% From Hi |
Featured
Date |
Price
Featured |
Pivot Featured |
|
Max Buy |
PAYC
-
NYSE
Paycom Software Inc
COMPUTER SOFTWARE and SERVICES - Application Software
|
$190.16
|
+1.40
0.74% |
$192.00
|
359,403
54.13% of 50 DAV
50 DAV is 664,000
|
$193.75
-1.85%
|
2/6/2019
|
$171.66
|
PP = $164.18
|
|
MB = $172.39
|
Most Recent Note - 4/11/2019 1:38:54 PM
G - It has not formed a sound new base of sufficient length but stubbornly held its ground. Its 50 DMA line ($179) defines important near-term support to watch above prior lows.
>>> FEATURED STOCK ARTICLE : Consolidating Near All-Time High - 3/8/2019 |
View all notes |
Set NEW NOTE alert |
Company Profile |
SEC
News |
Chart |
Request a new note
C
A
S
I |
PYPL
-
NASDAQ
Paypal Holdings Inc
Finance-CrdtCard/PmtPr
|
$108.14
|
-0.34
-0.31% |
$109.00
|
4,347,243
65.53% of 50 DAV
50 DAV is 6,634,000
|
$108.54
-0.37%
|
1/24/2019
|
$92.56
|
PP = $93.80
|
|
MB = $98.49
|
Most Recent Note - 4/9/2019 3:49:20 PM
G - Hitting another new all-time high with today's 3rd consecutive volume-driven gain, very extended from any sound base after gains with lighter than average volume in recent weeks. Its 50 DMA line ($98) and prior highs in the $94 area define important near-term support to watch on pullbacks.
>>> FEATURED STOCK ARTICLE : Extended From Base After Gains in Recent Weeks Lacking Volume - 4/2/2019 |
View all notes |
Set NEW NOTE alert |
Company Profile |
SEC
News |
Chart |
Request a new note
C
A
S
I |
ALRM
-
NASDAQ
Alarm.com Holdings Inc
Security/Sfty
|
$68.76
|
+0.43
0.63% |
$69.61
|
312,229
65.32% of 50 DAV
50 DAV is 478,000
|
$68.82
-0.09%
|
1/22/2019
|
$60.52
|
PP = $60.30
|
|
MB = $63.32
|
Most Recent Note - 4/11/2019 1:35:13 PM
G - Hitting new 52-week and all-time highs with today's 5th consecutive gain. Recently found prompt support near the 50 DMA line after it reported earnings +12% on +25% sales revenues for the Dec '18 quarter, below the +25% minimum earnings guideline (C criteria), raising fundamental concerns.
>>> FEATURED STOCK ARTICLE : Consolidating Near 50-Day Average Following Sub Par Report - 3/29/2019 |
View all notes |
Set NEW NOTE alert |
Company Profile |
SEC
News |
Chart |
Request a new note
C
A
S
I |
PLNT
-
NYSE
Planet Fitness Inc Cl A
Leisure-Services
|
$73.29
|
+1.79
2.50% |
$73.45
|
1,190,209
82.88% of 50 DAV
50 DAV is 1,436,000
|
$72.04
1.74%
|
11/7/2018
|
$57.10
|
PP = $55.45
|
|
MB = $58.22
|
Most Recent Note - 4/11/2019 1:40:09 PM
G - Holding its ground near its all-time high, very extended from any sound base. Its 50 DMA line (63.74) defines near-term support above prior highs in the $59-60 area. Fundamentals remain strong.
>>> FEATURED STOCK ARTICLE : Perched Near High Very Extended From Prior Base - 4/5/2019 |
View all notes |
Set NEW NOTE alert |
Company Profile |
SEC
News |
Chart |
Request a new note
C
A
S
I |
TEAM
-
NASDAQ
Atlassian Corp Plc Cl A
Comp Sftwr-Spec Enterprs
|
$114.45
|
+1.77
1.57% |
$117.06
|
2,081,419
144.24% of 50 DAV
50 DAV is 1,443,000
|
$116.70
-1.93%
|
1/7/2019
|
$94.68
|
PP = $98.31
|
|
MB = $103.23
|
Most Recent Note - 4/15/2019 12:47:22 PM
G - Due to report financial results for the quarter ended March 31, 2019 after market close on Wednesday, April 17, 2019. Volume and volatility often increase near earnings news. Endured distributional pressure in recent weeks and it is extended from any sound base. Its 50 DMA line ($108.43) and recent lows define near-term support to watch. Fundamentals remain strong.
>>> FEATURED STOCK ARTICLE : Perched Near High Enduring Distributional Pressure - 4/9/2019 |
View all notes |
Set NEW NOTE alert |
Company Profile |
SEC
News |
Chart |
Request a new note
C
A
S
I |
Symbol/Exchange
Company Name
Industry Group |
PRICE |
CHANGE
(%Change) |
Day High |
Volume
(% DAV)
(% 50 day avg vol) |
52 Wk Hi
% From Hi |
Featured
Date |
Price
Featured |
Pivot Featured |
|
Max Buy |
GLOB
-
NYSE
Globant SA
Computer-Tech Services
|
$80.74
|
-0.85
-1.04% |
$82.33
|
139,452
67.70% of 50 DAV
50 DAV is 206,000
|
$81.80
-1.30%
|
2/15/2019
|
$69.35
|
PP = $70.00
|
|
MB = $73.50
|
Most Recent Note - 4/10/2019 12:47:24 PM
G - Hitting yet another new all-time high with today's 3rd volume-driven gain in the span of 4 sessions. Found support at its 50 DMA line ($70.42) and above prior lows in the $66-67 area. Violations would raise concerns and trigger technical sell signals.
>>> FEATURED STOCK ARTICLE : Consolidating Near 50-Day Average Quietly Perched Near High - 3/26/2019 |
View all notes |
Set NEW NOTE alert |
Company Profile |
SEC
News |
Chart |
Request a new note
C
A
S
I |
TTD
-
NASDAQ
The Trade Desk Inc Cl A
Comml Svcs-Advertising
|
$202.16
|
+1.66
0.83% |
$202.69
|
713,472
43.16% of 50 DAV
50 DAV is 1,653,000
|
$214.70
-5.84%
|
2/6/2019
|
$148.65
|
PP = $149.00
|
|
MB = $156.45
|
Most Recent Note - 4/11/2019 1:42:11 PM
G - Consolidating above its 50 DMA line ($184) which defines initial support to watch above the prior low ($178.30 on 3/27/19).
>>> FEATURED STOCK ARTICLE : Hit Another New All-Time High Getting Extended From Prior Base - 3/21/2019 |
View all notes |
Set NEW NOTE alert |
Company Profile |
SEC
News |
Chart |
Request a new note
C
A
S
I |