You are not logged in.
This means you
CAN ONLY VIEW reports that were published prior to Sunday, February 25, 2024.
You
MUST UPGRADE YOUR MEMBERSHIP if you want to see any current reports.
AFTER MARKET UPDATE - TUESDAY, APRIL 14TH, 2020
Previous After Market Report Next After Market Report >>>
|
|
|
|
DOW |
+558.99 |
23,949.76 |
+2.39% |
|
Volume |
1,159,393,370 |
-0% |
|
Volume |
3,716,221,600 |
+18% |
|
NASDAQ |
+323.32 |
8,515.74 |
+3.95% |
|
Advancers |
2,195 |
75% |
|
Advancers |
2,286 |
71% |
|
S&P 500 |
+84.43 |
2,846.06 |
+3.06% |
|
Decliners |
726 |
25% |
|
Decliners |
936 |
29% |
|
Russell 2000 |
+25.29 |
1,237.33 |
+2.09% |
|
52 Wk Highs |
21 |
|
|
52 Wk Highs |
31 |
|
|
S&P 600 |
+12.75 |
731.10 |
+1.77% |
|
52 Wk Lows |
6 |
|
|
52 Wk Lows |
19 |
|
|
 |
Major Indices Rallied With Positive Breadth and More Leadership
Kenneth J. Gruneisen - Passed the CAN SLIM® Master's Exam
The Dow added 558 points, while the S&P 500 gained 3.1% to its best level in a month. The Nasdaq Composite was up 4%. Breadth was positive as advancers led decliners by a 3-1 margin on the NYSE and by more than a 2-1 margin on the Nasdaq exchange. The reported volume totals were mixed, slightly lighter than the prior session total on the NYSE and yet much higher on the Nasdaq exchange. Leadership improved as 21 high-ranked companies from the Leaders List hit new 52-week highs and were listed on the BreakOuts Page, versus 10 on the prior session. New 52-week highs outnumbered the new 52-week lows totals on the NYSE and on the Nasdaq exchange. The major indices (M criteria) are in a new confirmed uptrend. Any sustainable rally requires a healthy crop of new leaders. Charts used courtesy of www.stockcharts.com
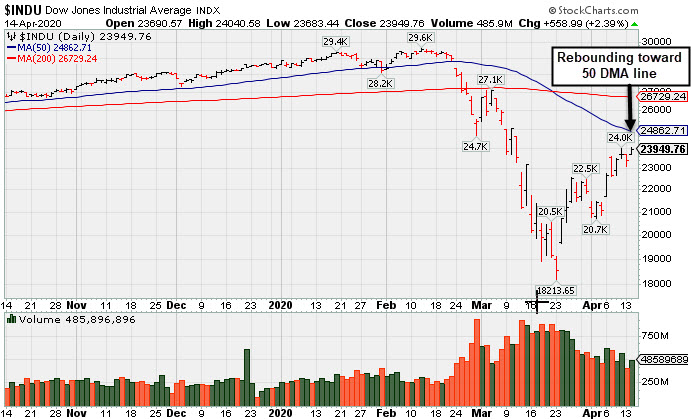
PICTURED: The Dow Jones Industrial Average posted a solid gain, rebounding toward its 50-day moving average (DMA) line. The follow-through day of big confirming gains on Monday, April 6th from the major indices on higher volume, coupled with an increase in the number of stocks hitting new highs, signaled a valid new market uptrend (M criteria).
Stocks finished higher on Tuesday as investors weighed an improving virus outlook against mixed earnings reports. More countries are considering lifting restrictions and reopening business activity sooner than previously anticipated amid expectations that the COVID-19 outbreak may have peaked.
Ten of 11 S&P 500 sectors closed in positive territory with Tech and Consumer Discretionary stocks outperforming. Apple (AAPL +5.05%) rose after iPhone shipments to China increased 19% year-over-year in March. Amazon (AMZN +5.28%) rallied to an all-time high. Financials lagged on a relative basis amid disappointing quarterly results from some of Wall Street’s biggest banks. JP Morgan Chase & Co (JPM -2.74%) fell after reporting its lowest profit in six years as a significant buildup in potential loan default reserves pressured its bottom line. In other earnings, Johnson & Johnson (JNJ +4.48%) rose after exceeding profit and revenue estimates and raising its dividend. Roku (ROKU +10.33%) rose after its quarterly results indicated a spike in streaming service demand.
Investors are bracing for heightened uncertainty surrounding corporate profit tallies. First-quarter S&P 500 earnings are now projected to decline more than 11%, according to Bloomberg.
Treasuries strengthened, with the yield on 10-year note down two basis points to 0.74%. In commodities, WTI crude extended Monday’s drop after the International Monetary Fund projected global GDP to shrink by 3% this year, suggesting a dismal outlook for energy demand. Meanwhile, COMEX gold closed at its best level since October 2012. |
 Kenneth J. Gruneisen started out as a licensed stockbroker in August 1987, a couple of months prior to the historic stock market crash that took the Dow Jones Industrial Average down -22.6% in a single day. He has published daily fact-based fundamental and technical analysis on high-ranked stocks online for two decades. Through FACTBASEDINVESTING.COM, Kenneth provides educational articles, news, market commentary, and other information regarding proven investment systems that work in good times and bad.
Comments contained in the body of this report are technical opinions only and are not necessarily those of Gruneisen Growth Corp. The material herein has been obtained from sources believed to be reliable and accurate, however, its accuracy and completeness cannot be guaranteed. Our firm, employees, and customers may effect transactions, including transactions contrary to any recommendation herein, or have positions in the securities mentioned herein or options with respect thereto. Any recommendation contained in this report may not be suitable for all investors and it is not to be deemed an offer or solicitation on our part with respect to the purchase or sale of any securities. |
|
 |
Retail and Tech Indexes Led Group Gainers
Kenneth J. Gruneisen - Passed the CAN SLIM® Master's Exam
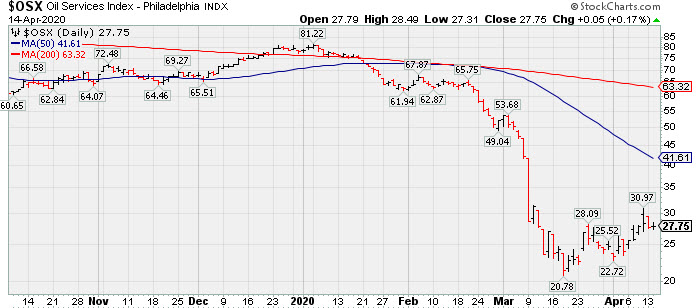
The Retail Index ($RLX +4.55%) was a standout gainer while the Broker/Dealer Index ($XBD +1.41%) posted a smaller gain and the Bank Index ($BKX -1.45%) fell. The tech sector had a positive bias as the Semiconductor Index ($SOX +4.44%) outpaced the Biotech Index ($BTK +3.08%) and the Networking Index ($NWX +3.40%). The Gold & Silver Index ($XAU +1.00%) posted a gain and the Oil Services Index ($OSX +0.17%) inched higher, but the Integrated Oil Index ($XOI -0.88%) lost ground. PICTURED: The Oil Services Index ($OSX +0.17%) has rebounded from its March 2020 low.
| Oil Services |
$OSX |
27.75 |
+0.05 |
+0.18% |
-64.55% |
| Integrated Oil |
$XOI |
694.09 |
-6.19 |
-0.88% |
-45.37% |
| Semiconductor |
$SOX |
1,695.76 |
+72.08 |
+4.44% |
-8.32% |
| Networking |
$NWX |
510.95 |
+16.78 |
+3.40% |
-12.42% |
| Broker/Dealer |
$XBD |
234.41 |
+3.27 |
+1.41% |
-19.27% |
| Retail |
$RLX |
2,512.03 |
+109.32 |
+4.55% |
+2.56% |
| Gold & Silver |
$XAU |
106.22 |
+1.05 |
+1.00% |
-0.65% |
| Bank |
$BKX |
71.25 |
-1.04 |
-1.44% |
-37.15% |
| Biotech |
$BTK |
4,889.14 |
+145.97 |
+3.08% |
-3.52% |
|
|
|
 |
Featured Stocks
Kenneth J. Gruneisen - Passed the CAN SLIM® Master's Exam
As leadership improves the number of stocks covered in this area should be expected to increase gradually, as superior candidates are added to the Featured Stocks list on a case-by-case basis. Feel free to contact us if you have a need for any additional information. |
|
|
Color Codes Explained :
Y - Better candidates highlighted by our
staff of experts.
G - Previously featured
in past reports as yellow but may no longer be buyable under the
guidelines.
***Last / Change / Volume data in this table is the closing quote data***
|
|
|
THESE ARE NOT BUY RECOMMENDATIONS!
Comments contained in the body of this report are technical
opinions only. The material herein has been obtained
from sources believed to be reliable and accurate, however,
its accuracy and completeness cannot be guaranteed.
This site is not an investment advisor, hence it does
not endorse or recommend any securities or other investments.
Any recommendation contained in this report may not
be suitable for all investors and it is not to be deemed
an offer or solicitation on our part with respect to
the purchase or sale of any securities. All trademarks,
service marks and trade names appearing in this report
are the property of their respective owners, and are
likewise used for identification purposes only.
This report is a service available
only to active Paid Premium Members.
You may opt-out of receiving report notifications
at any time. Questions or comments may be submitted
by writing to Premium Membership Services 665 S.E. 10 Street, Suite 201 Deerfield Beach, FL 33441-5634 or by calling 1-800-965-8307
or 954-785-1121.
|
|
|