***Last / Change / Volume data in this table is the closing quote data***
Symbol/Exchange
Company Name
Industry Group |
PRICE |
CHANGE
(%Change) |
Day High |
Volume
(% DAV)
(% 50 day avg vol) |
52 Wk Hi
% From Hi |
Featured
Date |
Price
Featured |
Pivot Featured |
|
Max Buy |
MLR
-
NYSE
Miller Industries Inc
AUTOMOTIVE - Auto Parts
|
$32.78
|
+0.71
2.21% |
$33.09
|
30,522
80.32% of 50 DAV
50 DAV is 38,000
|
$35.26
-7.03%
|
11/30/2018
|
$28.35
|
PP = $29.50
|
|
MB = $30.98
|
Most Recent Note - 4/8/2019 5:56:10 PM
G - Closed back below its 50 DMA line ($31.93). Prior highs in the $29 area define the next near-term support to watch. Reported earnings +17% on +13% sales revenues for the Dec '18 quarter, below the +25% minimum guideline (C criteria), raising fundamental concerns, and it has endured mild distributional pressure in recent weeks. See the latest FSU analysis for more details and a new annotated graph.
>>> FEATURED STOCK ARTICLE : Below 50-Day Average After Damaging Losses - 4/8/2019 |
View all notes |
Set NEW NOTE alert |
Company Profile |
SEC
News |
Chart |
Request a new note
C
A
S
I |
NSP
-
NYSE
Insperity Inc
Comml Svcs-Outsourcing
|
$129.39
|
-0.23
-0.18% |
$130.41
|
214,790
58.53% of 50 DAV
50 DAV is 367,000
|
$132.50
-2.35%
|
2/11/2019
|
$127.91
|
PP = $121.25
|
|
MB = $127.31
|
Most Recent Note - 4/9/2019 3:54:12 PM
Y - Color code is changed to yellow while quietly pulling back bellow its "max buy" level again. Found support while consolidating above its 50 DMA line ($122.26) and near prior highs in the $119-121 area which define important near-term support to watch.
>>> FEATURED STOCK ARTICLE : Volume Totals Cooling and Consolidating Near Prior Highs - 3/14/2019 |
View all notes |
Set NEW NOTE alert |
Company Profile |
SEC
News |
Chart |
Request a new note
C
A
S
I |
ZBRA
-
NASDAQ
Zebra Tech Corp Cl A
COMPUTER HARDWARE - Computer Peripherals
|
$233.74
|
+7.04
3.11% |
$234.00
|
568,839
124.75% of 50 DAV
50 DAV is 456,000
|
$226.99
2.97%
|
2/14/2019
|
$198.10
|
PP = $184.85
|
|
MB = $194.09
|
 Most Recent Note - 4/12/2019 12:44:24 PM
G - Hitting another new all-time high today, getting very extended from any sound base. Its 50 DMA line ($203.86) defines near-term support to watch on pullbacks.
>>> FEATURED STOCK ARTICLE : Zebra Extended From Prior Base - 3/25/2019 |
View all notes |
Set NEW NOTE alert |
Company Profile |
SEC
News |
Chart |
Request a new note
C
A
S
I |
FTNT
-
NASDAQ
Fortinet Inc
Computer Sftwr-Security
|
$92.71
|
+3.03
3.38% |
$92.91
|
2,423,776
135.63% of 50 DAV
50 DAV is 1,787,000
|
$94.37
-1.76%
|
4/10/2019
|
$89.76
|
PP = $88.70
|
|
MB = $93.14
|
Most Recent Note - 4/12/2019 12:06:23 PM
Y - Still below the "max buy" level, yet approaching its all-time high with today's 6th consecutive gain. Highlighted in yellow in the 4/10/19 mid-day report with pivot point cited based on its 2/25/19 high plus 10 cents. The gain with +57% above average volume triggered a technical buy signal, rising from a flat base during which its 50 DMA line ($84.38) acted as support.
>>> FEATURED STOCK ARTICLE : Volume-Driven Gain Cleared Flat Base and Little Resistance Remains - 4/10/2019 |
View all notes |
Set NEW NOTE alert |
Company Profile |
SEC
News |
Chart |
Request a new note
C
A
S
I |
SPSC
-
NASDAQ
S P S Commerce Inc
COMPUTER SOFTWARE and SERVICES - Application Software
|
$104.27
|
-2.70
-2.52% |
$107.77
|
77,142
48.21% of 50 DAV
50 DAV is 160,000
|
$113.31
-7.98%
|
3/26/2019
|
$107.12
|
PP = $113.41
|
|
MB = $119.08
|
Most Recent Note - 4/9/2019 3:50:45 PM
Y - Found prompt support today near prior highs and its 50 DMA line ($102.99). Subsequent gains above the pivot point backed by at least +40% above average volume may trigger a new (or add-on) technical buy signal.
>>> FEATURED STOCK ARTICLE : Consolidating in Orderly Fashion Above Prior Highs - 3/22/2019 |
View all notes |
Set NEW NOTE alert |
Company Profile |
SEC
News |
Chart |
Request a new note
C
A
S
I |
Symbol/Exchange
Company Name
Industry Group |
PRICE |
CHANGE
(%Change) |
Day High |
Volume
(% DAV)
(% 50 day avg vol) |
52 Wk Hi
% From Hi |
Featured
Date |
Price
Featured |
Pivot Featured |
|
Max Buy |
SSNC
-
NASDAQ
S S & C Technologies
COMPUTER SOFTWARE and SERVICES - Application Software
|
$65.29
|
-0.38
-0.58% |
$66.30
|
1,082,450
61.40% of 50 DAV
50 DAV is 1,763,000
|
$65.76
-0.71%
|
2/15/2019
|
$59.73
|
PP = $61.07
|
|
MB = $64.12
|
Most Recent Note - 4/10/2019 5:11:01 PM
G - Color code is changed to green after rising above its "max buy" level today and ending near its all-time high. Its 50 DMA line ($60) and prior low define near term support to watch.
>>> FEATURED STOCK ARTICLE : Hovering Near High With Volume Totals Cooling in Recent Weeks - 3/27/2019 |
View all notes |
Set NEW NOTE alert |
Company Profile |
SEC
News |
Chart |
Request a new note
C
A
S
I |
IRBT
-
NASDAQ
Irobot Corp
CONSUMER DURABLES - Electronic Equipment
|
$128.04
|
+0.13
0.10% |
$130.00
|
405,977
46.72% of 50 DAV
50 DAV is 869,000
|
$132.88
-3.64%
|
2/8/2019
|
$104.92
|
PP = $103.63
|
|
MB = $108.81
|
Most Recent Note - 4/9/2019 3:56:33 PM
G - Perched within striking distance of its all-time high with volume totals cooling. Its 50 DMA line ($116.28) and recent low ($114.40 on 3/27/19) define important near-term support while building a new base.
>>> FEATURED STOCK ARTICLE : Consolidating After Getting Extended from Double Bottom Base - 3/12/2019 |
View all notes |
Set NEW NOTE alert |
Company Profile |
SEC
News |
Chart |
Request a new note
C
A
S
I |
AUDC
-
NASDAQ
Audiocodes Ltd
ELECTRONICS - Scientific and Technical Instrum
|
$15.67
|
-0.07
-0.44% |
$15.85
|
148,977
69.94% of 50 DAV
50 DAV is 213,000
|
$16.36
-4.19%
|
3/20/2019
|
$13.66
|
PP = $15.06
|
|
MB = $15.81
|
Most Recent Note - 4/11/2019 5:13:56 PM
Y - Pulled back with light volume and its color code is changed to yellow after retreating below its "max buy" level. Prior high ($14.96) defines initial support to watch above its 50 DMA line ($13.86).
>>> FEATURED STOCK ARTICLE : Building a Base and Found Support Near 50-Day Moving Average - 3/20/2019 |
View all notes |
Set NEW NOTE alert |
Company Profile |
SEC
News |
Chart |
Request a new note
C
A
S
I |
ENV
-
NYSE
Envestnet Inc
FINANCIAL SERVICES - Diversified Investments
|
$68.82
|
-0.05
-0.07% |
$69.32
|
192,888
66.06% of 50 DAV
50 DAV is 292,000
|
$68.91
-0.13%
|
3/15/2019
|
$66.05
|
PP = $64.90
|
|
MB = $68.15
|
Most Recent Note - 4/11/2019 1:46:48 PM
G - Color code is changed to green after rallying above its "max buy" level today and hitting a new all-time high. The recent low ($63.34 on 3/27/19) and 50 DMA line define near-term support to watch on pullbacks.
>>> FEATURED STOCK ARTICLE : Volume Heavy Behind Rally to New Highs - 3/15/2019 |
View all notes |
Set NEW NOTE alert |
Company Profile |
SEC
News |
Chart |
Request a new note
C
A
S
I |
LHCG
-
NASDAQ
L H C Group Inc
HEALTH SERVICES - Home Health Care
|
$106.43
|
-0.59
-0.55% |
$107.87
|
312,058
126.85% of 50 DAV
50 DAV is 246,000
|
$115.54
-7.88%
|
1/23/2019
|
$107.29
|
PP = $107.61
|
|
MB = $112.99
|
Most Recent Note - 4/12/2019 12:26:22 PM
G - Slump below its 50 DMA line raised concerns. A prompt rebound above the 50 DMA line ($109.65) is needed for its outlook to improve. Prior low ($106.04 on 3/28/19) defines the next important near-term support above its 200 DMA line ($98.86).
>>> FEATURED STOCK ARTICLE : Sputtering Near 50-Day Moving Average Line - 4/1/2019 |
View all notes |
Set NEW NOTE alert |
Company Profile |
SEC
News |
Chart |
Request a new note
C
A
S
I |
Symbol/Exchange
Company Name
Industry Group |
PRICE |
CHANGE
(%Change) |
Day High |
Volume
(% DAV)
(% 50 day avg vol) |
52 Wk Hi
% From Hi |
Featured
Date |
Price
Featured |
Pivot Featured |
|
Max Buy |
ENSG
-
NASDAQ
Ensign Group Inc
HEALTH SERVICES - Long-Term Care Facilities
|
$51.76
|
+0.71
1.39% |
$52.16
|
401,811
124.40% of 50 DAV
50 DAV is 323,000
|
$54.56
-5.13%
|
2/7/2019
|
$48.71
|
PP = $49.06
|
|
MB = $51.51
|
Most Recent Note - 4/8/2019 4:51:23 PM
Y - Color code is changed to yellow after a light volume pullback below the "max buy" level. Found support near prior highs in the $48 area and above its 50 DMA line ($49.28) defining the important near-term support.
>>> FEATURED STOCK ARTICLE : Consolidating Near Proir High and Above 50-Day Average - 3/11/2019 |
View all notes |
Set NEW NOTE alert |
Company Profile |
SEC
News |
Chart |
Request a new note
C
A
S
I |
LULU
-
NASDAQ
Lululemon Athletica
MANUFACTURING - Textile Manufacturing
|
$169.88
|
+1.88
1.12% |
$170.68
|
1,482,450
64.37% of 50 DAV
50 DAV is 2,303,000
|
$172.90
-1.75%
|
3/28/2019
|
$169.20
|
PP = $164.89
|
|
MB = $173.13
|
Most Recent Note - 4/8/2019 4:37:04 PM
Y - Prior highs define initial support to watch on pullbacks. Stubbornly holding its ground since a "breakaway gap" on 3/28/19 triggered a technical buy signal. Bullish action came after it reported Jan '19 earnings +39% on +26% sales revenues, marking its 5th consecutive quarterly comparison above the +25% minimum guideline (C criteria).
>>> FEATURED STOCK ARTICLE : Breakway Gap Backed by More Than 6 Times Average Volume - 3/28/2019 |
View all notes |
Set NEW NOTE alert |
Company Profile |
SEC
News |
Chart |
Request a new note
C
A
S
I |
NXST
-
NASDAQ
Nexstar Media Group Cl A
MEDIA - Broadcasting - TV
|
$115.81
|
+0.60
0.52% |
$116.15
|
409,778
73.44% of 50 DAV
50 DAV is 558,000
|
$115.82
-0.01%
|
2/26/2019
|
$94.26
|
PP = $89.76
|
|
MB = $94.25
|
Most Recent Note - 4/11/2019 1:37:08 PM
G - Perched at its all-time high, very extended from any sound base. Disciplined investors avoid chasing stocks more than +5% above the prior high. Its 50 DMA line ($100) defines near-term support to watch on pullbacks.
>>> FEATURED STOCK ARTICLE : Hitting New High and Very Extended From Prior Base - 4/4/2019 |
View all notes |
Set NEW NOTE alert |
Company Profile |
SEC
News |
Chart |
Request a new note
C
A
S
I |
ULTA
-
NASDAQ
Ulta Beauty Inc
SPECIALTY RETAIL - Specialty Retail, Other
|
$344.83
|
-5.39
-1.54% |
$351.88
|
554,928
71.33% of 50 DAV
50 DAV is 778,000
|
$355.73
-3.06%
|
3/15/2019
|
$341.27
|
PP = $322.59
|
|
MB = $338.72
|
Most Recent Note - 4/11/2019 1:44:07 PM
G - Volume totals have been cooling while stubbornly holding its ground near its all-time high after rallying above its "max buy" level. Bullish action came after it reported earnings +31% sales revenues on +10% sales revenues for the Jan '19 quarter.
>>> FEATURED STOCK ARTICLE : Consolidating Following Big "Breakaway Gap" - 3/19/2019 |
View all notes |
Set NEW NOTE alert |
Company Profile |
SEC
News |
Chart |
Request a new note
C
A
S
I |
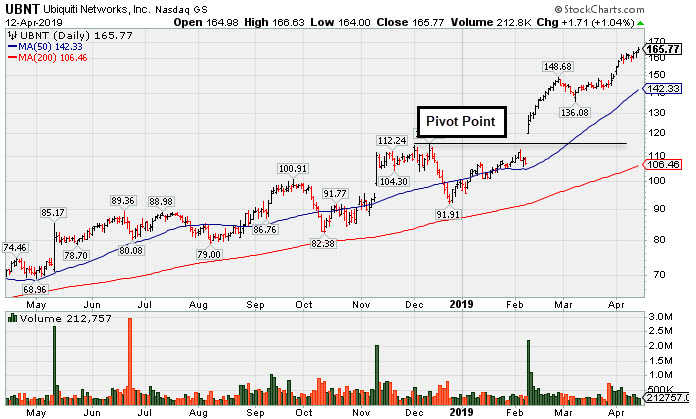
UBNT
-
NASDAQ
Ubiquiti Networks
TELECOMMUNICATIONS - Diversified Communication Serv
|
$165.77
|
+1.71
1.04% |
$166.64
|
208,686
53.37% of 50 DAV
50 DAV is 391,000
|
$164.48
0.78%
|
2/8/2019
|
$121.97
|
PP = $115.54
|
|
MB = $121.32
|
Most Recent Note - 4/12/2019 5:01:45 PM
G - Hit a new all-time high with today's 3rd consecutive gain backed by lighter volume. Extended from any sound base, but held its ground stubbornly after a big rally. Its 50 DMA line ($142) and prior low ($136.08 on 3/08/19) define near-term support to watch on pullbacks. Fundamentals remain strong. See the latest FSU analysis for more details and a new annotated graph.
>>> FEATURED STOCK ARTICLE : Extended From Any Sound Bass and Wedging to New Highs - 4/12/2019 |
View all notes |
Set NEW NOTE alert |
Company Profile |
SEC
News |
Chart |
Request a new note
C
A
S
I |
Symbol/Exchange
Company Name
Industry Group |
PRICE |
CHANGE
(%Change) |
Day High |
Volume
(% DAV)
(% 50 day avg vol) |
52 Wk Hi
% From Hi |
Featured
Date |
Price
Featured |
Pivot Featured |
|
Max Buy |
ESNT
-
NYSE
Essent Group Ltd
Finance-MrtgandRel Svc
|
$45.90
|
+0.41
0.90% |
$46.53
|
482,001
76.27% of 50 DAV
50 DAV is 632,000
|
$47.94
-4.26%
|
3/18/2019
|
$45.84
|
PP = $45.06
|
|
MB = $47.31
|
Most Recent Note - 4/9/2019 3:46:32 PM
Y - Abruptly retreating today after 6 consecutive gains lacking great volume conviction. Found support above its 50 DMA line ($43.39) reassuringly on the recent pullback. Still faces some resistance due to overhead supply up to the $50 level. Fundamentals are strong.
>>> FEATURED STOCK ARTICLE : Big Breakout Gain With +350% Above Average Volume - 3/18/2019 |
View all notes |
Set NEW NOTE alert |
Company Profile |
SEC
News |
Chart |
Request a new note
C
A
S
I |
FIVE
-
NASDAQ
Five Below Inc
Retail-DiscountandVariety
|
$134.97
|
+1.42
1.06% |
$135.28
|
1,236,487
124.27% of 50 DAV
50 DAV is 995,000
|
$136.13
-0.85%
|
4/11/2019
|
$132.05
|
PP = $133.75
|
|
MB = $140.44
|
Most Recent Note - 4/11/2019 5:12:24 PM
Y - Finished strong after highlighted in yellow with new pivot point cited based on its 2/12/19 high plus 10 cents in the earlier mid-day report. Subsequent gains backed by at least +40% above average volume and a strong close above the pivot point may clinch a technical buy signal. Faces very little resistance due to overhead supply up to the $136 level. Recently reported earnings +34% on +19% sales revenues for the Jan '19 quarter versus the year ago period. Three of the past 4 quarterly earnings comparisons had increases above the +25% minimum guideline (C criteria). Went through a deep consolidation since dropped from the Featured Stocks list on 11/27/18. See the latest FSU analysis for more details and a new annotated graph.
>>> FEATURED STOCK ARTICLE : Finished Strong After Featured Again in Mid-Day Report - 4/11/2019 |
View all notes |
Set NEW NOTE alert |
Company Profile |
SEC
News |
Chart |
Request a new note
C
A
S
I |
NOW
-
NYSE
Servicenow Inc
Computer Sftwr-Enterprse
|
$244.30
|
-1.47
-0.60% |
$247.74
|
988,837
47.96% of 50 DAV
50 DAV is 2,062,000
|
$251.65
-2.92%
|
1/31/2019
|
$218.14
|
PP = $206.40
|
|
MB = $216.72
|
Most Recent Note - 4/9/2019 3:52:53 PM
G - Extended from any sound base, finding support at its 50 DMA line ($235) recently. Below that important short-term average the recent low ($226.71 on 3/08/19) defines near-term support to watch. More damaging losses would raise concerns and trigger technical sell signals.
>>> FEATURED STOCK ARTICLE : Pulling Back After 6 Straight Weekly Gains - 3/6/2019 |
View all notes |
Set NEW NOTE alert |
Company Profile |
SEC
News |
Chart |
Request a new note
C
A
S
I |
PANW
-
NYSE
Palo Alto Networks
Computer Sftwr-Security
|
$244.66
|
-1.27
-0.52% |
$247.38
|
804,732
57.85% of 50 DAV
50 DAV is 1,391,000
|
$260.63
-6.13%
|
2/25/2019
|
$233.54
|
PP = $239.60
|
|
MB = $251.58
|
Most Recent Note - 4/9/2019 3:59:18 PM
Y - Volume totals have been cooling while consolidating above its 50 DMA line ($234) defining important support to watch above the prior low ($230.36 on 3/08/19). Fundamentals remain strong.
>>> FEATURED STOCK ARTICLE : Consolidating Above Prior High and 50-Day Average - 4/3/2019 |
View all notes |
Set NEW NOTE alert |
Company Profile |
SEC
News |
Chart |
Request a new note
C
A
S
I |
ANET
-
NYSE
Arista Networks Inc
TELECOMMUNICATIONS - Communication Equipment
|
$324.77
|
+2.54
0.79% |
$326.50
|
455,837
51.16% of 50 DAV
50 DAV is 891,000
|
$325.00
-0.07%
|
3/13/2019
|
$295.38
|
PP = $313.37
|
|
MB = $329.04
|
Most Recent Note - 4/8/2019 5:00:30 PM
Y - Managed a "positive reversal" today for a gain with lighter than average volume. It rebounded above its pivot point but remains below the "max buy" level previously noted.
>>> FEATURED STOCK ARTICLE : Rebounding Near High After Deep Consolidation - 3/13/2019 |
View all notes |
Set NEW NOTE alert |
Company Profile |
SEC
News |
Chart |
Request a new note
C
A
S
I |
Symbol/Exchange
Company Name
Industry Group |
PRICE |
CHANGE
(%Change) |
Day High |
Volume
(% DAV)
(% 50 day avg vol) |
52 Wk Hi
% From Hi |
Featured
Date |
Price
Featured |
Pivot Featured |
|
Max Buy |
PAYC
-
NYSE
Paycom Software Inc
COMPUTER SOFTWARE and SERVICES - Application Software
|
$188.76
|
+0.18
0.10% |
$190.35
|
311,169
46.51% of 50 DAV
50 DAV is 669,000
|
$193.75
-2.58%
|
2/6/2019
|
$171.66
|
PP = $164.18
|
|
MB = $172.39
|
Most Recent Note - 4/11/2019 1:38:54 PM
G - It has not formed a sound new base of sufficient length but stubbornly held its ground. Its 50 DMA line ($179) defines important near-term support to watch above prior lows.
>>> FEATURED STOCK ARTICLE : Consolidating Near All-Time High - 3/8/2019 |
View all notes |
Set NEW NOTE alert |
Company Profile |
SEC
News |
Chart |
Request a new note
C
A
S
I |
PYPL
-
NASDAQ
Paypal Holdings Inc
Finance-CrdtCard/PmtPr
|
$108.48
|
+2.02
1.90% |
$108.54
|
6,921,031
98.21% of 50 DAV
50 DAV is 7,047,000
|
$107.77
0.66%
|
1/24/2019
|
$92.56
|
PP = $93.80
|
|
MB = $98.49
|
Most Recent Note - 4/9/2019 3:49:20 PM
G - Hitting another new all-time high with today's 3rd consecutive volume-driven gain, very extended from any sound base after gains with lighter than average volume in recent weeks. Its 50 DMA line ($98) and prior highs in the $94 area define important near-term support to watch on pullbacks.
>>> FEATURED STOCK ARTICLE : Extended From Base After Gains in Recent Weeks Lacking Volume - 4/2/2019 |
View all notes |
Set NEW NOTE alert |
Company Profile |
SEC
News |
Chart |
Request a new note
C
A
S
I |
ALRM
-
NASDAQ
Alarm.com Holdings Inc
Security/Sfty
|
$68.33
|
+0.36
0.53% |
$68.82
|
155,489
31.93% of 50 DAV
50 DAV is 487,000
|
$68.20
0.19%
|
1/22/2019
|
$60.52
|
PP = $60.30
|
|
MB = $63.32
|
Most Recent Note - 4/11/2019 1:35:13 PM
G - Hitting new 52-week and all-time highs with today's 5th consecutive gain. Recently found prompt support near the 50 DMA line after it reported earnings +12% on +25% sales revenues for the Dec '18 quarter, below the +25% minimum earnings guideline (C criteria), raising fundamental concerns.
>>> FEATURED STOCK ARTICLE : Consolidating Near 50-Day Average Following Sub Par Report - 3/29/2019 |
View all notes |
Set NEW NOTE alert |
Company Profile |
SEC
News |
Chart |
Request a new note
C
A
S
I |
PLNT
-
NYSE
Planet Fitness Inc Cl A
Leisure-Services
|
$71.50
|
+0.28
0.39% |
$72.04
|
746,434
51.23% of 50 DAV
50 DAV is 1,457,000
|
$71.77
-0.38%
|
11/7/2018
|
$57.10
|
PP = $55.45
|
|
MB = $58.22
|
Most Recent Note - 4/11/2019 1:40:09 PM
G - Holding its ground near its all-time high, very extended from any sound base. Its 50 DMA line (63.74) defines near-term support above prior highs in the $59-60 area. Fundamentals remain strong.
>>> FEATURED STOCK ARTICLE : Perched Near High Very Extended From Prior Base - 4/5/2019 |
View all notes |
Set NEW NOTE alert |
Company Profile |
SEC
News |
Chart |
Request a new note
C
A
S
I |
TEAM
-
NASDAQ
Atlassian Corp Plc Cl A
Comp Sftwr-Spec Enterprs
|
$112.68
|
-1.76
-1.54% |
$115.67
|
1,531,298
105.17% of 50 DAV
50 DAV is 1,456,000
|
$116.70
-3.44%
|
1/7/2019
|
$94.68
|
PP = $98.31
|
|
MB = $103.23
|
Most Recent Note - 4/9/2019 5:20:01 PM
G - Endured distributional pressure in recent weeks and it is extended from any sound base. Its 50 DMA line ($107) and recent lows define near-term support to watch. Fundamentals remain strong. See the latest FSU analysis for more details and a new annotated graph.
>>> FEATURED STOCK ARTICLE : Perched Near High Enduring Distributional Pressure - 4/9/2019 |
View all notes |
Set NEW NOTE alert |
Company Profile |
SEC
News |
Chart |
Request a new note
C
A
S
I |
Symbol/Exchange
Company Name
Industry Group |
PRICE |
CHANGE
(%Change) |
Day High |
Volume
(% DAV)
(% 50 day avg vol) |
52 Wk Hi
% From Hi |
Featured
Date |
Price
Featured |
Pivot Featured |
|
Max Buy |
GLOB
-
NYSE
Globant SA
Computer-Tech Services
|
$81.59
|
+1.77
2.22% |
$81.80
|
233,754
113.47% of 50 DAV
50 DAV is 206,000
|
$80.50
1.35%
|
2/15/2019
|
$69.35
|
PP = $70.00
|
|
MB = $73.50
|
Most Recent Note - 4/10/2019 12:47:24 PM
G - Hitting yet another new all-time high with today's 3rd volume-driven gain in the span of 4 sessions. Found support at its 50 DMA line ($70.42) and above prior lows in the $66-67 area. Violations would raise concerns and trigger technical sell signals.
>>> FEATURED STOCK ARTICLE : Consolidating Near 50-Day Average Quietly Perched Near High - 3/26/2019 |
View all notes |
Set NEW NOTE alert |
Company Profile |
SEC
News |
Chart |
Request a new note
C
A
S
I |
TTD
-
NASDAQ
The Trade Desk Inc Cl A
Comml Svcs-Advertising
|
$200.50
|
+0.14
0.07% |
$205.84
|
880,901
53.13% of 50 DAV
50 DAV is 1,658,000
|
$214.70
-6.61%
|
2/6/2019
|
$148.65
|
PP = $149.00
|
|
MB = $156.45
|
Most Recent Note - 4/11/2019 1:42:11 PM
G - Consolidating above its 50 DMA line ($184) which defines initial support to watch above the prior low ($178.30 on 3/27/19).
>>> FEATURED STOCK ARTICLE : Hit Another New All-Time High Getting Extended From Prior Base - 3/21/2019 |
View all notes |
Set NEW NOTE alert |
Company Profile |
SEC
News |
Chart |
Request a new note
C
A
S
I |