You are not logged in.
This means you
CAN ONLY VIEW reports that were published prior to Monday, February 19, 2024.
You
MUST UPGRADE YOUR MEMBERSHIP if you want to see any current reports.
AFTER MARKET UPDATE - MONDAY, APRIL 11TH, 2022
Previous After Market Report Next After Market Report >>>
|
|
|
|
DOW |
-413.04 |
34,308.08 |
-1.19% |
|
Volume |
926,719,108 |
+10% |
|
Volume |
4,810,931,300 |
+8% |
|
NASDAQ |
-299.04 |
13,411.96 |
-2.18% |
|
Advancers |
952 |
30% |
|
Advancers |
1,514 |
34% |
|
S&P 500 |
-75.75 |
4,412.53 |
-1.69% |
|
Decliners |
2,237 |
70% |
|
Decliners |
2,952 |
66% |
|
Russell 2000 |
-14.24 |
1,980.32 |
-0.71% |
|
52 Wk Highs |
66 |
|
|
52 Wk Highs |
70 |
|
|
S&P 600 |
-7.82 |
1,265.02 |
-0.61% |
|
52 Wk Lows |
300 |
|
|
52 Wk Lows |
407 |
|
|
 |
Major Indices Slump With Higher Volume Indicating Distribution
Kenneth J. Gruneisen - Passed the CAN SLIM® Master's Exam
The Dow lost 413 points, while the S&P 500 fell 1.7%. The Nasdaq Composite dropped 2.2% as the recent sell-off in growth-oriented shares persisted. The tech-heavy benchmark is more than 16.4% below its November peak. Volume totals reported were higher than the prior session on the NYSE and on the Nasdaq exchange, revealing an increase in institutional selling pressure. Breadth was negative as decliners led advancers by more than a 2-1 margin on the NYSE and nearly 2-1 on the Nasdaq exchange. There were 35 high-ranked companies from the Leaders List that hit new 52-week highs and were listed on the BreakOuts Page, versus 38 on the prior session. New 52-week lows totals expanded and solidly outnumbered shrinking new 52-week highs totals on the NYSE and on the Nasdaq exchange. The major indices are in an uptrend that has come under pressure (M criteria). Strict followers of the fact-based investment system only buy stocks fitting all key fundamental and technical investment criteria.
Chart courtesy of www.stockcharts.com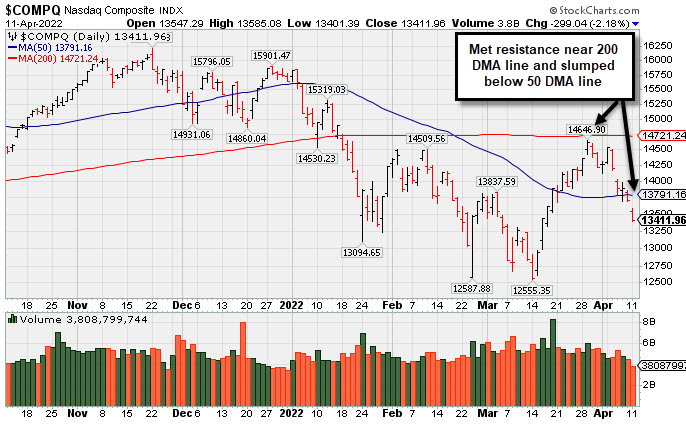 PICTURED: The Nasdaq Composite Index met resistance near its 200-day moving average (DMA) line in recent weeks and now has slumped back below its 50 DMA line. Volume behind Monday's loss was higher than the prior session, indicative of more distribiutional pressure (volume bar is not updated to the close on graph above).
U.S. stocks finished near session lows on Monday as investors monitored the swift rise in Treasury yields. The ongoing Russian-Ukraine war and COVID-19 lockdowns in China also remained market headwinds.
The rout in Treasuries deepened, with the yield on the 10-year note climbing eight basis points (0.08%) to 2.78%, its highest level since January 2019. Last week, 10-year Treasury yields jumped the most since the 2016 U.S. presidential election (+0.33%) as investors weighed an increasingly hawkish Federal Reserve focused on reining in the highest inflation in 40 years. Tomorrow, all eyes will be on the latest Consumer Price Index (CPI) report, with an 8.4% year-over-year increase widely anticipated to represent the peak figure on an annual basis. Investors will also turn their attention to the start of earnings season as some of Wall Street’s biggest banks begin to report on Wednesday. Overall, S&P 500 profits are forecasted to have grown 5.5% year-over-year during the first quarter, according to Bloomberg.
All 11 S&P 500 sectors closed in negative territory, with Energy leading the downturn amid a drop in oil prices. West Texas Intermediate crude declined 3.4% to $94.96/barrel as rising COVID-19 cases in China dampened the outlook for global demand. Technology shares also lagged, with semiconductors among the worst-performing groups. NVIDIA Corp. (NVDA -5.20%) fell following an analyst downgrade. Elsewhere, shares of AT&T (T +3.27%) rose after completing the spin-off of its WarnerMedia unit to Discovery Communications.
|
 Kenneth J. Gruneisen started out as a licensed stockbroker in August 1987, a couple of months prior to the historic stock market crash that took the Dow Jones Industrial Average down -22.6% in a single day. He has published daily fact-based fundamental and technical analysis on high-ranked stocks online for two decades. Through FACTBASEDINVESTING.COM, Kenneth provides educational articles, news, market commentary, and other information regarding proven investment systems that work in good times and bad.
Comments contained in the body of this report are technical opinions only and are not necessarily those of Gruneisen Growth Corp. The material herein has been obtained from sources believed to be reliable and accurate, however, its accuracy and completeness cannot be guaranteed. Our firm, employees, and customers may effect transactions, including transactions contrary to any recommendation herein, or have positions in the securities mentioned herein or options with respect thereto. Any recommendation contained in this report may not be suitable for all investors and it is not to be deemed an offer or solicitation on our part with respect to the purchase or sale of any securities. |
|
 |
Retail, Tech, and Commodity-Linked Groups Fell
Kenneth J. Gruneisen - Passed the CAN SLIM® Master's Exam
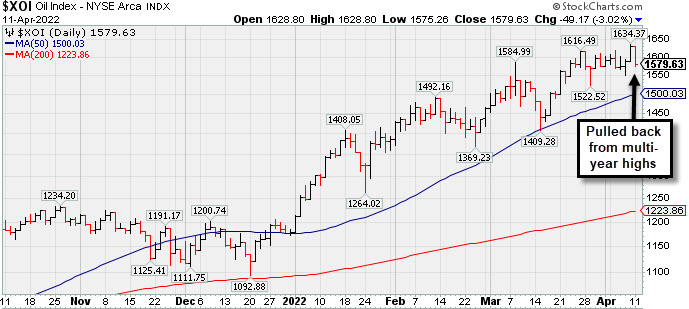
The Retail Index ($RLX -1.56%), Semiconductor Index ($SOX -2.09%), Networking Index ($NWX -1.42%), and Biotech Index ($BTK -2.51%) suffered unanimous losses. The Oil Services Index ($OSX -2.80%) and Integrated Oil Index ($XOI -3.02%) both suffered large losses while the Gold & Silver Index ($XAU -0.55%) edged lower. The Broker/Dealer Index ($XBD -0.58%) also edged lower and the Bank Index ($BKX -0.01%) finished flat. PICTURED: The Integrated Oil Index ($XOI -3.02%) pulled back from multi-year highs.
| Oil Services |
$OSX |
79.96 |
-2.31 |
-2.80% |
+51.67% |
| Integrated Oil |
$XOI |
1,579.63 |
-49.17 |
-3.02% |
+34.07% |
| Semiconductor |
$SOX |
3,055.09 |
-65.08 |
-2.09% |
-22.58% |
| Networking |
$NWX |
837.52 |
-12.06 |
-1.42% |
-13.75% |
| Broker/Dealer |
$XBD |
441.86 |
-2.60 |
-0.58% |
-9.24% |
| Retail |
$RLX |
3,693.86 |
-58.55 |
-1.56% |
-12.60% |
| Gold & Silver |
$XAU |
162.77 |
-0.91 |
-0.55% |
+22.89% |
| Bank |
$BKX |
119.78 |
-0.01 |
-0.01% |
-9.41% |
| Biotech |
$BTK |
5,172.49 |
-133.00 |
-2.51% |
-6.27% |
|
|
|
 |
Closed Near Session Low and Below Pivot Point Cited
Kenneth J. Gruneisen - Passed the CAN SLIM® Master's Exam
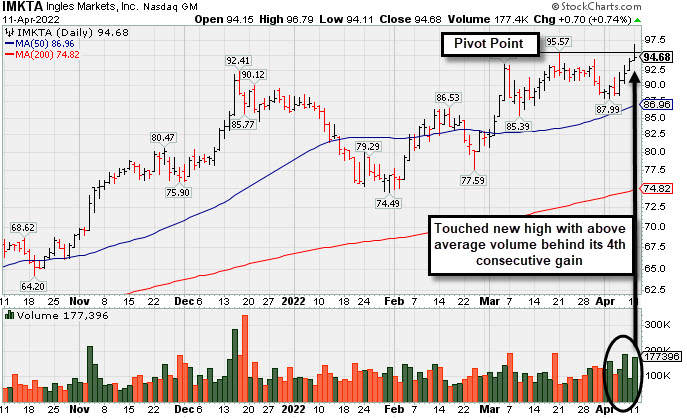
Ingles Markets Inc Cl A (IMKTA +$0.70 or +0.74% to $94.68) posted a 4th consecutive gain backed by above average volume, however, after hitting a new all-time high it closed below its pivot point. It was highlighted in yellow in the earlier mid-day reoprt (read here) with pivot point cited based on its 3/21/22 high after a cup-with-high-handle base pattern. Subsequent gains and a close above its pivot point backed by at least +40% above average volume may clinch a convincing new technical buy signal.
IMKTA has a 96 Earnings Per Share Rating, well above the 80+ minimum for buy candidates. It reported Dec '21 earnings +31% on +17% sales revenues versus the year ago period. Three of the past 4 quarterly comparisons were above the +25% minimum earnings guideline (C criteria). Annual earnings growth (A criteria) has been very strong in recent years.
The company hails from the Retail - Super/Mini Markets industry group which is currrently ranked 15th on the 197 Industry Groups list (L criteria). Its small supply of only 10.4 million shares in the public float (A criteria) can contribute to greater price volatility in the event of institutional buying or selling. The number of top-rated funds owning its shares rose from 344 in Sep '21 to 378 in Mar '22, a reassuring sign concerning the I criteria. Its current Up/Down Volume Ratio of 1.4 is an unbiased indication its shares have been under accumulation over the past 50 days. |
|
|
Color Codes Explained :
Y - Better candidates highlighted by our
staff of experts.
G - Previously featured
in past reports as yellow but may no longer be buyable under the
guidelines.
***Last / Change / Volume data in this table is the closing quote data***
|
|
|
THESE ARE NOT BUY RECOMMENDATIONS!
Comments contained in the body of this report are technical
opinions only. The material herein has been obtained
from sources believed to be reliable and accurate, however,
its accuracy and completeness cannot be guaranteed.
This site is not an investment advisor, hence it does
not endorse or recommend any securities or other investments.
Any recommendation contained in this report may not
be suitable for all investors and it is not to be deemed
an offer or solicitation on our part with respect to
the purchase or sale of any securities. All trademarks,
service marks and trade names appearing in this report
are the property of their respective owners, and are
likewise used for identification purposes only.
This report is a service available
only to active Paid Premium Members.
You may opt-out of receiving report notifications
at any time. Questions or comments may be submitted
by writing to Premium Membership Services 665 S.E. 10 Street, Suite 201 Deerfield Beach, FL 33441-5634 or by calling 1-800-965-8307
or 954-785-1121.
|
|
|