You are not logged in.
This means you
CAN ONLY VIEW reports that were published prior to Tuesday, February 20, 2024.
You
MUST UPGRADE YOUR MEMBERSHIP if you want to see any current reports.
AFTER MARKET UPDATE - THURSDAY, APRIL 9TH, 2020
Previous After Market Report Next After Market Report >>>
|
|
|
|
DOW |
+285.80 |
23,719.37 |
+1.22% |
|
Volume |
1,506,629,403 |
+24% |
|
Volume |
4,130,159,500 |
+20% |
|
NASDAQ |
+62.68 |
8,153.58 |
+0.77% |
|
Advancers |
2,495 |
86% |
|
Advancers |
2,514 |
78% |
|
S&P 500 |
+39.84 |
2,789.82 |
+1.45% |
|
Decliners |
418 |
14% |
|
Decliners |
728 |
22% |
|
Russell 2000 |
+55.06 |
1,246.73 |
+4.62% |
|
52 Wk Highs |
12 |
|
|
52 Wk Highs |
17 |
|
|
S&P 600 |
+36.15 |
743.23 |
+5.11% |
|
52 Wk Lows |
2 |
|
|
52 Wk Lows |
16 |
|
|
Disciplined investors shall notice a new confirmed uptrend marked by a solid follow-through day. For any clarification or additional help applying the fact-based investment system, we invite members to call, or contact us via the inquiry form.
|
 |
Breadth Positive and Volume Higher Behind Major Indices' New Rally
Kenneth J. Gruneisen - Passed the CAN SLIM® Master's Exam
Thursday’s moves capped a holiday-shortened week with robust weekly gains. The Dow jumped 285 points to finish the week up 12.7%. The S&P 500 rose 1.5% on the day, and logged its best weekly performance since 1974 with a 12.1% gain. The Nasdaq Composite added 0.8% on the session and 10.6% for the week. Breadth was clearly positive as advancers led decliners by almost a 6-1 margin on the NYSE and by more than a 3-1 margin on the Nasdaq exchange. The reported volume totals were higher than the prior session totals on the NYSE and on the Nasdaq exchange, revealing an increase in buying conviction coming from the institutional crowd. Leadership improved slightly as 5 high-ranked companies from the Leaders List hit new 52-week highs and were listed on the BreakOuts Page, versus 2 on the prior session. New 52-week highs outnumbered the new 52-week lows totals on both the NYSE and on the Nasdaq exchange. The major indices (M criteria) are in a new confirmed uptrend. Any sustainable rally requires a healthy crop of new leaders. Charts used courtesy of www.stockcharts.com
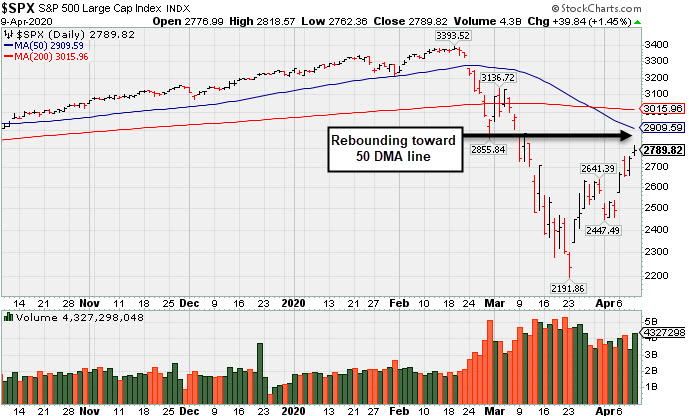
PICTURED: The S&P 500 Index posted a gain with higher volume on Thursday. Disciplined investors know that a follow-through day of big confirming gains on Monday, April 6th from the major indices on higher volume coupled with an increase in the number of stocks hitting new highs signaled a valid new market uptrend (M criteria).
Stocks advanced on Thursday, as a surprise monetary stimulus measure overshadowed a disappointing jobless number. The Federal Reserve announced plans to deliver an additional $2.3 trillion in lending aimed at small and mid-sized businesses. Fed Chair Jerome Powell also noted that policy makers remained committed to utilizing all of the central bank’s tools to support the economy.
On the data front, initial jobless claims rose 6.6 million in the week ending April 4, adding to the more than 10 million claims filed in the prior two periods. Another report from the University of Michigan showed consumer sentiment fell the most on record in April. Treasuries strengthened, with the yield on the benchmark 10-year note dropping four basis points to 0.72%.
Ten of 11 S&P 500 sectors finished in positive territory, with the Financials group pacing the gains. Energy stocks lagged with WTI crude falling 5.6% to $23.68/barrel, extending its weekly decline after that the deal between OPEC and its allies to curb output was widely viewed as insufficient to balance a slump in global demand. Travel related stocks continued to outperform, with United Airlines (UAL +14.50%) and Norwegian Cruise Lines (NCLH +11.95%) both jumping. In corporate news, Disney (DIS +3.39%) rose after the company reported more than 50 million Disney+ subscribers globally. |
 Kenneth J. Gruneisen started out as a licensed stockbroker in August 1987, a couple of months prior to the historic stock market crash that took the Dow Jones Industrial Average down -22.6% in a single day. He has published daily fact-based fundamental and technical analysis on high-ranked stocks online for two decades. Through FACTBASEDINVESTING.COM, Kenneth provides educational articles, news, market commentary, and other information regarding proven investment systems that work in good times and bad.
Comments contained in the body of this report are technical opinions only and are not necessarily those of Gruneisen Growth Corp. The material herein has been obtained from sources believed to be reliable and accurate, however, its accuracy and completeness cannot be guaranteed. Our firm, employees, and customers may effect transactions, including transactions contrary to any recommendation herein, or have positions in the securities mentioned herein or options with respect thereto. Any recommendation contained in this report may not be suitable for all investors and it is not to be deemed an offer or solicitation on our part with respect to the purchase or sale of any securities. |
|
 |
Gold & Silver a Standout as Financial and Retail Indexes Rose
Kenneth J. Gruneisen - Passed the CAN SLIM® Master's Exam
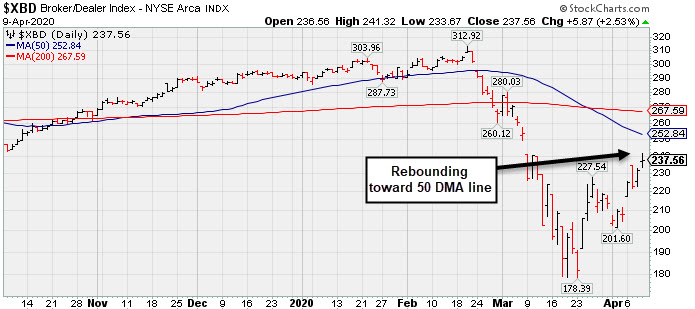
The Bank Index ($BKX +6.81%) and Broker/Dealer Index ($XBD +2.53%) both outpaced the Retail Index ($RLX +0.78%). The tech sector was mixed as the Semiconductor Index ($SOX -2.33%) fell while the Biotech Index ($BTK +0.20%) and the Networking Index ($NWX +0.20%) eked out small gains. Energy-linked shares were mixed as the Oil Services Index ($OSX +1.64%) rose and the Integrated Oil Index ($XOI -1.43%) fell. The Gold & Silver Index ($XAU +9.51%) posted a standout gain. PICTURED: The Broker/Dealer Index ($XBD +2.53%) is rebounding from its March 2020 low toward its 50-day moving average (DMA) line.
| Oil Services |
$OSX |
28.33 |
+0.45 |
+1.61% |
-63.81% |
| Integrated Oil |
$XOI |
707.93 |
-10.23 |
-1.43% |
-44.28% |
| Semiconductor |
$SOX |
1,601.73 |
-38.16 |
-2.33% |
-13.40% |
| Networking |
$NWX |
502.84 |
+0.99 |
+0.20% |
-13.81% |
| Broker/Dealer |
$XBD |
237.56 |
+5.87 |
+2.53% |
-18.19% |
| Retail |
$RLX |
2,332.23 |
+18.11 |
+0.78% |
-4.78% |
| Gold & Silver |
$XAU |
98.22 |
+8.52 |
+9.50% |
-8.14% |
| Bank |
$BKX |
75.26 |
+4.80 |
+6.81% |
-33.61% |
| Biotech |
$BTK |
4,734.18 |
+9.23 |
+0.20% |
-6.58% |
|
|
|
 |
Volume-Driven Breakout Indicative of Institutional Buying Demand
Kenneth J. Gruneisen - Passed the CAN SLIM® Master's Exam
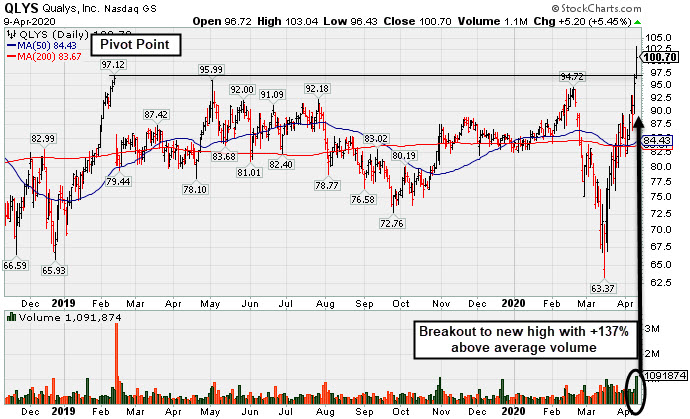
Qualys Inc (QLYS +$5.20 or +5.45% $100.70) finished strong after highlighted in yellow with new pivot point cited based on its 2/12/19 high plus 10 cents in the earlier mid-day report (read here). It powered to new 52-week and all-time highs with today's big volume-driven gain adding to an impressive spurt of gains from below its 50-day and 200-day moving average (DMA) lines. The volume-driven gains above the pivot point for a new high (N criteria) may be an indication of fresh institutional buying demand that can lead to a meaningful and sustained advance in price.
Fundamentals remain strong after it reported Dec '19 earnings +25% on +14% sales revenues, , its 11th consecutive quarter above the +25% minimum earnings guideline (C criteria). Its annual earnings history (A criteria) has also been strong. The Computer Software - Security group has a 84 Group Relative Strength Rating, and leadership (L criteria) in the industry group is another favorable factor with respect to the fact-based investment system.
It went through a choppy consolidation since dropped from the Featured Stocks list when noted with caution on 6/26/19. Relative Strength Rating of 95 is now above the 80+ minimum guideline for buy candidates. It previously met stubborn resistance in the $97 area. QLYS was last shown in this FSU section on 6/11/19 with annotated graphs under the headline, "Encountering Distributional Pressure in Recent Weeks".
Currently it has a Timeliness Rating of A and Sponsorship Rating of E. Its Accumulation/Distribution rating is A- while its Up/Down Volume Ratio of 1.2 is an unbiased indication its shares have been under accumulation over the past 50 days. The number of top-rated funds owning its shares rose from 294 in Jun '17 to 476 in Dec '19, a reassuring sign concerning the I criteria. Its small supply of only 32.1 million shares (S criteria) in the public float can contribute to greater volatility in the event of institutional buying or selling.
|
|
|
Color Codes Explained :
Y - Better candidates highlighted by our
staff of experts.
G - Previously featured
in past reports as yellow but may no longer be buyable under the
guidelines.
***Last / Change / Volume data in this table is the closing quote data***
Symbol/Exchange
Company Name
Industry Group |
PRICE |
CHANGE
(%Change) |
Day High |
Volume
(% DAV)
(% 50 day avg vol) |
52 Wk Hi
% From Hi |
Featured
Date |
Price
Featured |
Pivot Featured |
|
Max Buy |
 QLYS
-
NASDAQ
QLYS
-
NASDAQ
Qualys Inc
Computer Sftwr-Security
|
$100.70
|
+5.20
5.45% |
$103.04
|
1,094,114
237.85% of 50 DAV
50 DAV is 460,000
|
$97.24
3.56%
|
4/9/2020
|
$100.44
|
PP = $97.22
|
|
MB = $102.08
|
 Most Recent Note - 4/9/2020 12:42:29 PM
Y - Color code is changed to yellow with new pivot point cited based on its 2/12/19 high plus 10 cents. Powering to new 52-week and all-time highs with today's big volume-driven gain adding to an impressive spurt of gains from below its 50 and 200 DMA lines. Fundamentals remain strong after it reported Dec '19 earnings +25% on +14% sales revenues, continuing its strong earnings track record. Went through a choppy consolidation since dropped from the Featured Stocks list when noted with caution on 6/26/19. Relative Strength Rating of 95 is now above the 80+ minimum guideline for buy candidates.
>>> FEATURED STOCK ARTICLE : Volume-Driven Breakout Indicative of Institutional Buying Demand - 4/9/2020 |
View all notes |
Set NEW NOTE alert |
Company Profile |
SEC
News |
Chart |
Request a new note
C
A
S
I |
|
|
|
THESE ARE NOT BUY RECOMMENDATIONS!
Comments contained in the body of this report are technical
opinions only. The material herein has been obtained
from sources believed to be reliable and accurate, however,
its accuracy and completeness cannot be guaranteed.
This site is not an investment advisor, hence it does
not endorse or recommend any securities or other investments.
Any recommendation contained in this report may not
be suitable for all investors and it is not to be deemed
an offer or solicitation on our part with respect to
the purchase or sale of any securities. All trademarks,
service marks and trade names appearing in this report
are the property of their respective owners, and are
likewise used for identification purposes only.
This report is a service available
only to active Paid Premium Members.
You may opt-out of receiving report notifications
at any time. Questions or comments may be submitted
by writing to Premium Membership Services 665 S.E. 10 Street, Suite 201 Deerfield Beach, FL 33441-5634 or by calling 1-800-965-8307
or 954-785-1121.
|
|
|