You are not logged in.
This means you
CAN ONLY VIEW reports that were published prior to Saturday, February 24, 2024.
You
MUST UPGRADE YOUR MEMBERSHIP if you want to see any current reports.
AFTER MARKET UPDATE - WEDNESDAY, APRIL 8TH, 2020
Previous After Market Report Next After Market Report >>>
|
|
|
|
DOW |
+779.71 |
23,433.57 |
+3.44% |
|
Volume |
1,211,847,648 |
-18% |
|
Volume |
3,439,863,700 |
-15% |
|
NASDAQ |
+203.64 |
8,090.90 |
+2.58% |
|
Advancers |
2,621 |
89% |
|
Advancers |
2,723 |
84% |
|
S&P 500 |
+90.57 |
2,749.98 |
+3.41% |
|
Decliners |
315 |
11% |
|
Decliners |
536 |
16% |
|
Russell 2000 |
+52.49 |
1,191.66 |
+4.61% |
|
52 Wk Highs |
7 |
|
|
52 Wk Highs |
10 |
|
|
S&P 600 |
+29.43 |
707.08 |
+4.34% |
|
52 Wk Lows |
6 |
|
|
52 Wk Lows |
24 |
|
|
Disciplined investors shall notice a new confirmed uptrend marked by a solid follow-through day. For any clarification or additional help applying the fact-based investment system, we invite members to call, or contact us via the inquiry form.
|
 |
Breadth Positive as Major Indices Rose
Kenneth J. Gruneisen - Passed the CAN SLIM® Master's Exam
The Dow added 779 points, while the S&P 500 advanced 3.4% and ended the day 23% above its March 23rd close. The Nasdaq Composite gained 2.6%. Breadth was clearly positive as advancers led decliners by more than an 8-1 margin on the NYSE and 5-1 on the Nasdaq exchange. The reported volume totals were lighter than the prior session totals on the NYSE and on the Nasdaq exchange, revealing less buying conviction coming from the institutional crowd. Leadership remained thin as 2 high-ranked companies from the Leaders List hit new 52-week highs and were listed on the BreakOuts Page, versus 3 on the prior session. New 52-week lows outnumbered the new 52-week highs totals on both the NYSE and on the Nasdaq exchange. The major indices (M criteria) are in a new confirmed uptrend. Any sustainable rally requires a healthy crop of new leaders. Charts used courtesy of www.stockcharts.com
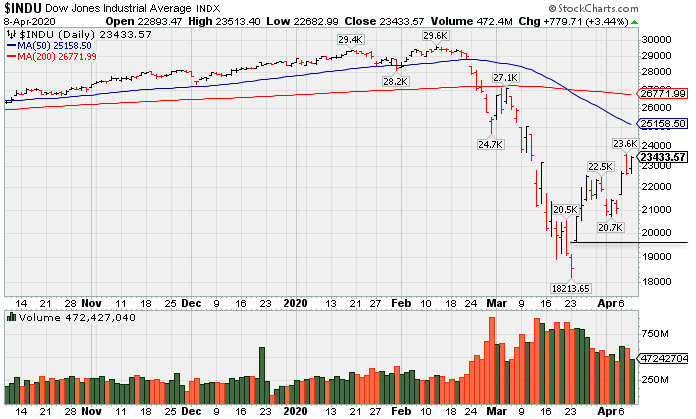
PICTURED: The Dow Jones Industrial Average posted a gain with lighter volume on Wednesday. Disciplined investors know that a follow-through day of big confirming gains on Monday, April 6th from the major indices on higher volume coupled with an increase in the number of stocks hitting new highs signaled a valid new market uptrend (M criteria).
Stocks finished higher Wednesday as investors evaluated the possibility of additional stimulus from Washington, along with speculation that COVID-19 could be nearing its peak. Dr. Anthony Fauci noted that the U.S. death count may be lower than initially projected, and the Trump administration has reportedly asked Congress for an additional $250 billion in aid for U.S. small businesses impacted by the coronavirus outbreak.
All 11 S&P 500 sectors finished the session in positive territory with the Real Estate group pacing the gains. The Energy sector was also a notable outperformer with WTI jumping 11.3% to $26.30/barrel. Optimism was spurred by reports that OPEC and its allies are nearing an agreement to cut oil production at its virtual meeting tomorrow. In corporate news, stocks that have been most pressured by the virus outbreak led today’s rally, with Wynn Resorts (WYNN +13.51%), Marriott International (MAR +11.80%), and United Airlines (UAL +12.38%) all gaining more than 11.0%.
In Treasuries, the yield on the two-year note slipped one basis point to 0.25% after the minutes from the Fed’s latest meeting indicated that policymakers planned to keep the Fed-funds rate near zero for the foreseeable future. According to the release, all participating officials agreed that the economic outlook had drastically deteriorated as a result of the COVID-19 pandemic and required a “forceful” response. Since the latest emergency meeting (March 15), the Fed has enacted a slew of other emergency programs meant to ensure sufficient liquidity in lending markets. |
 Kenneth J. Gruneisen started out as a licensed stockbroker in August 1987, a couple of months prior to the historic stock market crash that took the Dow Jones Industrial Average down -22.6% in a single day. He has published daily fact-based fundamental and technical analysis on high-ranked stocks online for two decades. Through FACTBASEDINVESTING.COM, Kenneth provides educational articles, news, market commentary, and other information regarding proven investment systems that work in good times and bad.
Comments contained in the body of this report are technical opinions only and are not necessarily those of Gruneisen Growth Corp. The material herein has been obtained from sources believed to be reliable and accurate, however, its accuracy and completeness cannot be guaranteed. Our firm, employees, and customers may effect transactions, including transactions contrary to any recommendation herein, or have positions in the securities mentioned herein or options with respect thereto. Any recommendation contained in this report may not be suitable for all investors and it is not to be deemed an offer or solicitation on our part with respect to the purchase or sale of any securities. |
|
 |
Energy, Tech, Financial, and Retail Indexes Rose
Kenneth J. Gruneisen - Passed the CAN SLIM® Master's Exam
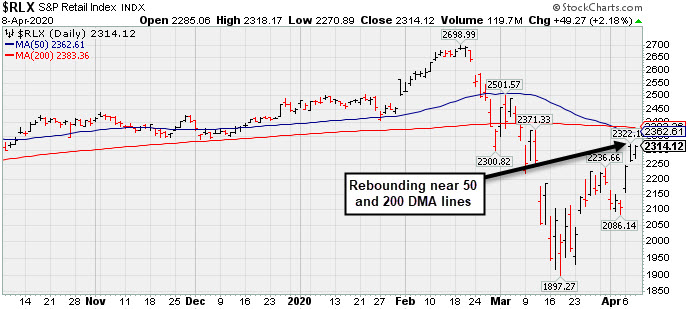
The Bank Index ($BKX +5.11%) and Broker/Dealer Index ($XBD +4.08%) both outpaced the Retail Index ($RLX +2.18%). The tech sector had a positive bias as the Semiconductor Index ($SOX +3.44%), Biotech Index ($BTK +2.90%), and the Networking Index ($NWX +3.53%) rose. Energy-linked shares were standout gainers as the Oil Services Index ($OSX +7.89%) and Integrated Oil Index ($XOI +6.62%) both rose considerably. The Gold & Silver Index ($XAU +0.82%) posted a smaller gain. PICTURED: The Retail Index ($RLX +2.18%) is rebounding from its March 2020 low toward its 50-day and 200-day moving average (DMA) lines.
| Oil Services |
$OSX |
27.88 |
+2.04 |
+7.89% |
-64.39% |
| Integrated Oil |
$XOI |
718.16 |
+44.60 |
+6.62% |
-43.48% |
| Semiconductor |
$SOX |
1,639.89 |
+54.51 |
+3.44% |
-11.34% |
| Networking |
$NWX |
501.85 |
+17.11 |
+3.53% |
-13.98% |
| Broker/Dealer |
$XBD |
231.69 |
+9.09 |
+4.08% |
-20.21% |
| Retail |
$RLX |
2,314.12 |
+49.27 |
+2.18% |
-5.52% |
| Gold & Silver |
$XAU |
89.70 |
+0.74 |
+0.83% |
-16.11% |
| Bank |
$BKX |
70.46 |
+3.43 |
+5.12% |
-37.84% |
| Biotech |
$BTK |
4,724.94 |
+133.21 |
+2.90% |
-6.76% |
|
|
|
 |
No Featured Stocks
Kenneth J. Gruneisen - Passed the CAN SLIM® Master's Exam
During extremely bearish markets the number of stocks covered in this area has sometimes been reduced to zero. We suggest making no excuses for weak stocks in weak markets. Feel free to contact us if you have a need for any additional information. |
|
|
Color Codes Explained :
Y - Better candidates highlighted by our
staff of experts.
G - Previously featured
in past reports as yellow but may no longer be buyable under the
guidelines.
***Last / Change / Volume data in this table is the closing quote data***
|
|
|
THESE ARE NOT BUY RECOMMENDATIONS!
Comments contained in the body of this report are technical
opinions only. The material herein has been obtained
from sources believed to be reliable and accurate, however,
its accuracy and completeness cannot be guaranteed.
This site is not an investment advisor, hence it does
not endorse or recommend any securities or other investments.
Any recommendation contained in this report may not
be suitable for all investors and it is not to be deemed
an offer or solicitation on our part with respect to
the purchase or sale of any securities. All trademarks,
service marks and trade names appearing in this report
are the property of their respective owners, and are
likewise used for identification purposes only.
This report is a service available
only to active Paid Premium Members.
You may opt-out of receiving report notifications
at any time. Questions or comments may be submitted
by writing to Premium Membership Services 665 S.E. 10 Street, Suite 201 Deerfield Beach, FL 33441-5634 or by calling 1-800-965-8307
or 954-785-1121.
|
|
|