***Last / Change / Volume data in this table is the closing quote data***
Symbol/Exchange
Company Name
Industry Group |
PRICE |
CHANGE
(%Change) |
Day High |
Volume
(% DAV)
(% 50 day avg vol) |
52 Wk Hi
% From Hi |
Featured
Date |
Price
Featured |
Pivot Featured |
|
Max Buy |
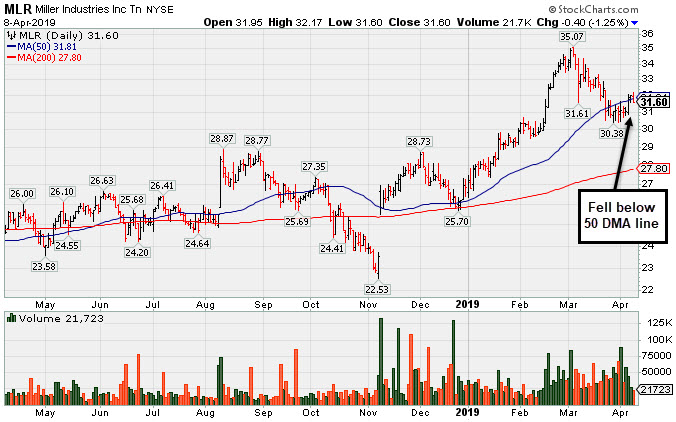
MLR
-
NYSE
Miller Industries Inc
AUTOMOTIVE - Auto Parts
|
$31.60
|
-0.40
-1.25% |
$32.18
|
21,723
57.17% of 50 DAV
50 DAV is 38,000
|
$35.26
-10.38%
|
11/30/2018
|
$28.35
|
PP = $29.50
|
|
MB = $30.98
|
 Most Recent Note - 4/8/2019 5:56:10 PM
G - Closed back below its 50 DMA line ($31.93). Prior highs in the $29 area define the next near-term support to watch. Reported earnings +17% on +13% sales revenues for the Dec '18 quarter, below the +25% minimum guideline (C criteria), raising fundamental concerns, and it has endured mild distributional pressure in recent weeks. See the latest FSU analysis for more details and a new annotated graph.
>>> FEATURED STOCK ARTICLE : Below 50-Day Average After Damaging Losses - 4/8/2019 |
View all notes |
Set NEW NOTE alert |
Company Profile |
SEC
News |
Chart |
Request a new note
C
A
S
I |
NSP
-
NYSE
Insperity Inc
Comml Svcs-Outsourcing
|
$127.84
|
-0.57
-0.44% |
$127.91
|
191,452
51.88% of 50 DAV
50 DAV is 369,000
|
$132.50
-3.52%
|
2/11/2019
|
$127.91
|
PP = $121.25
|
|
MB = $127.31
|
Most Recent Note - 4/3/2019 5:34:38 PM
G - Color code is changed to green after rising above its "max buy" level again. Found support while consolidating above its 50 DMA line ($120) and near prior highs in the $119-121 area which define important near-term support to watch.
>>> FEATURED STOCK ARTICLE : Volume Totals Cooling and Consolidating Near Prior Highs - 3/14/2019 |
View all notes |
Set NEW NOTE alert |
Company Profile |
SEC
News |
Chart |
Request a new note
C
A
S
I |
ZBRA
-
NASDAQ
Zebra Tech Corp Cl A
COMPUTER HARDWARE - Computer Peripherals
|
$221.44
|
+3.11
1.42% |
$221.83
|
447,582
99.02% of 50 DAV
50 DAV is 452,000
|
$219.66
0.81%
|
2/14/2019
|
$198.10
|
PP = $184.85
|
|
MB = $194.09
|
Most Recent Note - 4/8/2019 4:42:50 PM
G - Hit a new all-time high and ended near the session high with a gain backed by average volume conviction. Its 50 DMA line ($199.53) defines near-term support to watch.
>>> FEATURED STOCK ARTICLE : Zebra Extended From Prior Base - 3/25/2019 |
View all notes |
Set NEW NOTE alert |
Company Profile |
SEC
News |
Chart |
Request a new note
C
A
S
I |
SPSC
-
NASDAQ
S P S Commerce Inc
COMPUTER SOFTWARE and SERVICES - Application Software
|
$101.36
|
-1.60
-1.55% |
$103.46
|
180,175
118.54% of 50 DAV
50 DAV is 152,000
|
$113.31
-10.55%
|
3/26/2019
|
$107.12
|
PP = $113.41
|
|
MB = $119.08
|
Most Recent Note - 4/2/2019 5:55:18 PM
Y - Still consolidating in an orderly fashion well above prior highs in the $100 area defining support to watch along with its 50 DMA line ($101.34). Subsequent gains above the pivot point backed by at least +40% above average volume may trigger a new (or add-on) technical buy signal.
>>> FEATURED STOCK ARTICLE : Consolidating in Orderly Fashion Above Prior Highs - 3/22/2019 |
View all notes |
Set NEW NOTE alert |
Company Profile |
SEC
News |
Chart |
Request a new note
C
A
S
I |
SSNC
-
NASDAQ
S S & C Technologies
COMPUTER SOFTWARE and SERVICES - Application Software
|
$63.72
|
+0.08
0.13% |
$63.93
|
1,270,478
71.42% of 50 DAV
50 DAV is 1,779,000
|
$65.19
-2.25%
|
2/15/2019
|
$59.73
|
PP = $61.07
|
|
MB = $64.12
|
Most Recent Note - 4/4/2019 5:06:26 PM
Y - Still above its pivot point and below its "max buy" level, remaining perched near its all-time high. Its 50 DMA line ($58.93) and prior low define near term support to watch.
>>> FEATURED STOCK ARTICLE : Hovering Near High With Volume Totals Cooling in Recent Weeks - 3/27/2019 |
View all notes |
Set NEW NOTE alert |
Company Profile |
SEC
News |
Chart |
Request a new note
C
A
S
I |
Symbol/Exchange
Company Name
Industry Group |
PRICE |
CHANGE
(%Change) |
Day High |
Volume
(% DAV)
(% 50 day avg vol) |
52 Wk Hi
% From Hi |
Featured
Date |
Price
Featured |
Pivot Featured |
|
Max Buy |
IRBT
-
NASDAQ
Irobot Corp
CONSUMER DURABLES - Electronic Equipment
|
$123.86
|
-0.50
-0.40% |
$124.45
|
366,070
41.88% of 50 DAV
50 DAV is 874,000
|
$132.88
-6.79%
|
2/8/2019
|
$104.92
|
PP = $103.63
|
|
MB = $108.81
|
Most Recent Note - 4/2/2019 6:04:36 PM
G - Tallied 4 consecutive gains with lighter than average volume. Found prompt support near its August '18 high on the pullback. Its 50 DMA line ($112.55) defines important near-term support while possibly building a new base.
>>> FEATURED STOCK ARTICLE : Consolidating After Getting Extended from Double Bottom Base - 3/12/2019 |
View all notes |
Set NEW NOTE alert |
Company Profile |
SEC
News |
Chart |
Request a new note
C
A
S
I |
AUDC
-
NASDAQ
Audiocodes Ltd
ELECTRONICS - Scientific and Technical Instrum
|
$16.06
|
+0.44
2.82% |
$16.14
|
216,747
84.67% of 50 DAV
50 DAV is 256,000
|
$16.36
-1.80%
|
3/20/2019
|
$13.66
|
PP = $15.06
|
|
MB = $15.81
|
Most Recent Note - 4/8/2019 4:57:41 PM
G - Color code is changed to green after rallying above its "max buy" level. Prior high ($14.96) defines initial support to watch above its 50 DMA line ($13.78).
>>> FEATURED STOCK ARTICLE : Building a Base and Found Support Near 50-Day Moving Average - 3/20/2019 |
View all notes |
Set NEW NOTE alert |
Company Profile |
SEC
News |
Chart |
Request a new note
C
A
S
I |
ENV
-
NYSE
Envestnet Inc
FINANCIAL SERVICES - Diversified Investments
|
$67.01
|
+0.89
1.35% |
$67.32
|
237,321
84.46% of 50 DAV
50 DAV is 281,000
|
$67.52
-0.76%
|
3/15/2019
|
$66.05
|
PP = $64.90
|
|
MB = $68.15
|
Most Recent Note - 4/4/2019 4:01:21 PM
Y - Hovering near its all-time high. Stalled after its technical breakout was noted on 3/15/19. More damaging losses below the recent low ($63.34 on 3/27/19) would raise greater concerns.
>>> FEATURED STOCK ARTICLE : Volume Heavy Behind Rally to New Highs - 3/15/2019 |
View all notes |
Set NEW NOTE alert |
Company Profile |
SEC
News |
Chart |
Request a new note
C
A
S
I |
LHCG
-
NASDAQ
L H C Group Inc
HEALTH SERVICES - Home Health Care
|
$109.78
|
-1.07
-0.97% |
$110.87
|
171,735
71.56% of 50 DAV
50 DAV is 240,000
|
$115.54
-4.99%
|
1/23/2019
|
$107.29
|
PP = $107.61
|
|
MB = $112.99
|
Most Recent Note - 4/5/2019 5:11:05 PM
Y - Posted a solid gain today with near average volume, finding support while consolidating near its 50 DMA line ($109.37). Prior lows define the next important near-term support above its 200 DMA line.
>>> FEATURED STOCK ARTICLE : Sputtering Near 50-Day Moving Average Line - 4/1/2019 |
View all notes |
Set NEW NOTE alert |
Company Profile |
SEC
News |
Chart |
Request a new note
C
A
S
I |
ENSG
-
NASDAQ
Ensign Group Inc
HEALTH SERVICES - Long-Term Care Facilities
|
$50.83
|
-1.63
-3.11% |
$52.53
|
204,173
64.21% of 50 DAV
50 DAV is 318,000
|
$54.56
-6.84%
|
2/7/2019
|
$48.71
|
PP = $49.06
|
|
MB = $51.51
|
Most Recent Note - 4/8/2019 4:51:23 PM
Y - Color code is changed to yellow after a light volume pullback below the "max buy" level. Found support near prior highs in the $48 area and above its 50 DMA line ($49.28) defining the important near-term support.
>>> FEATURED STOCK ARTICLE : Consolidating Near Proir High and Above 50-Day Average - 3/11/2019 |
View all notes |
Set NEW NOTE alert |
Company Profile |
SEC
News |
Chart |
Request a new note
C
A
S
I |
Symbol/Exchange
Company Name
Industry Group |
PRICE |
CHANGE
(%Change) |
Day High |
Volume
(% DAV)
(% 50 day avg vol) |
52 Wk Hi
% From Hi |
Featured
Date |
Price
Featured |
Pivot Featured |
|
Max Buy |
LULU
-
NASDAQ
Lululemon Athletica
MANUFACTURING - Textile Manufacturing
|
$169.77
|
+0.40
0.24% |
$170.40
|
2,113,415
93.14% of 50 DAV
50 DAV is 2,269,000
|
$172.90
-1.81%
|
3/28/2019
|
$169.20
|
PP = $164.89
|
|
MB = $173.13
|
Most Recent Note - 4/8/2019 4:37:04 PM
Y - Prior highs define initial support to watch on pullbacks. Stubbornly holding its ground since a "breakaway gap" on 3/28/19 triggered a technical buy signal. Bullish action came after it reported Jan '19 earnings +39% on +26% sales revenues, marking its 5th consecutive quarterly comparison above the +25% minimum guideline (C criteria).
>>> FEATURED STOCK ARTICLE : Breakway Gap Backed by More Than 6 Times Average Volume - 3/28/2019 |
View all notes |
Set NEW NOTE alert |
Company Profile |
SEC
News |
Chart |
Request a new note
C
A
S
I |
NXST
-
NASDAQ
Nexstar Media Group Cl A
MEDIA - Broadcasting - TV
|
$111.78
|
-0.95
-0.84% |
$113.06
|
571,659
106.06% of 50 DAV
50 DAV is 539,000
|
$113.68
-1.67%
|
2/26/2019
|
$94.26
|
PP = $89.76
|
|
MB = $94.25
|
Most Recent Note - 4/4/2019 5:04:09 PM
G - Hit another new all-time high today, very extended from any sound base. Disciplined investors avoid chasing stocks more than +5% above the prior high. See the latest FSU analysis for more details and a new annotated graph.
>>> FEATURED STOCK ARTICLE : Hitting New High and Very Extended From Prior Base - 4/4/2019 |
View all notes |
Set NEW NOTE alert |
Company Profile |
SEC
News |
Chart |
Request a new note
C
A
S
I |
ULTA
-
NASDAQ
Ulta Beauty Inc
SPECIALTY RETAIL - Specialty Retail, Other
|
$354.47
|
+0.84
0.24% |
$355.73
|
433,424
55.57% of 50 DAV
50 DAV is 780,000
|
$354.44
0.01%
|
3/15/2019
|
$341.27
|
PP = $322.59
|
|
MB = $338.72
|
Most Recent Note - 4/4/2019 5:09:07 PM
G - Color code is changed to green while perched above its "max buy" level. Volume totals have been cooling while stubbornly holding its ground near its all-time high. Bullish action came after it reported earnings +31% sales revenues on +10% sales revenues for the Jan '19 quarter.
>>> FEATURED STOCK ARTICLE : Consolidating Following Big "Breakaway Gap" - 3/19/2019 |
View all notes |
Set NEW NOTE alert |
Company Profile |
SEC
News |
Chart |
Request a new note
C
A
S
I |
UBNT
-
NASDAQ
Ubiquiti Networks
TELECOMMUNICATIONS - Diversified Communication Serv
|
$162.20
|
+0.01
0.01% |
$162.70
|
297,503
77.47% of 50 DAV
50 DAV is 384,000
|
$163.24
-0.64%
|
2/8/2019
|
$121.97
|
PP = $115.54
|
|
MB = $121.32
|
Most Recent Note - 4/2/2019 6:09:25 PM
G - Hit yet another new all-time high with today's 4th consecutive volume-driven gain. It did not form a sound base of sufficient length but held its ground stubbornly after a big rally. Its prior low ($136.08 on 3/08/19) and 50 DMA line ($133.51) define near-term support to watch. Fundamentals remain strong.
>>> FEATURED STOCK ARTICLE : Bullish Action Came Following Another Strong Earnings Report - 3/5/2019 |
View all notes |
Set NEW NOTE alert |
Company Profile |
SEC
News |
Chart |
Request a new note
C
A
S
I |
ESNT
-
NYSE
Essent Group Ltd
Finance-MrtgandRel Svc
|
$46.51
|
+0.71
1.55% |
$46.60
|
377,735
60.73% of 50 DAV
50 DAV is 622,000
|
$47.94
-2.98%
|
3/18/2019
|
$45.84
|
PP = $45.06
|
|
MB = $47.31
|
Most Recent Note - 4/8/2019 4:34:51 PM
Y - Found support above its 50 DMA line ($43.27) reassuringly and wedged higher with 6 consecutive gains lacking great volume conviction. Still faces some resistance due to overhead supply up to the $50 level. Fundamentals are strong.
>>> FEATURED STOCK ARTICLE : Big Breakout Gain With +350% Above Average Volume - 3/18/2019 |
View all notes |
Set NEW NOTE alert |
Company Profile |
SEC
News |
Chart |
Request a new note
C
A
S
I |
Symbol/Exchange
Company Name
Industry Group |
PRICE |
CHANGE
(%Change) |
Day High |
Volume
(% DAV)
(% 50 day avg vol) |
52 Wk Hi
% From Hi |
Featured
Date |
Price
Featured |
Pivot Featured |
|
Max Buy |
NOW
-
NYSE
Servicenow Inc
Computer Sftwr-Enterprse
|
$237.21
|
+0.23
0.10% |
$239.38
|
1,425,005
68.48% of 50 DAV
50 DAV is 2,081,000
|
$251.65
-5.74%
|
1/31/2019
|
$218.14
|
PP = $206.40
|
|
MB = $216.72
|
Most Recent Note - 4/4/2019 1:01:17 PM
G - Testing its 50 DMA line ($231.88) with today's big loss on above average volume. Below that important short-term average the recent low ($226.71 on 3/08/19) defines near-term support to watch. More damaging losses would raise concerns and trigger technical sell signals.
>>> FEATURED STOCK ARTICLE : Pulling Back After 6 Straight Weekly Gains - 3/6/2019 |
View all notes |
Set NEW NOTE alert |
Company Profile |
SEC
News |
Chart |
Request a new note
C
A
S
I |
PANW
-
NYSE
Palo Alto Networks
Computer Sftwr-Security
|
$238.88
|
+0.03
0.01% |
$239.90
|
808,586
57.67% of 50 DAV
50 DAV is 1,402,000
|
$260.63
-8.35%
|
2/25/2019
|
$233.54
|
PP = $239.60
|
|
MB = $251.58
|
Most Recent Note - 4/3/2019 5:33:10 PM
Y - Volume totals have been cooling while still consolidating above its prior low and above its 50 DMA line defining important support to watch in the $230 area. Fundamentals remain strong. See the latest FSU analysis for more details and a new annotated graph.
>>> FEATURED STOCK ARTICLE : Consolidating Above Prior High and 50-Day Average - 4/3/2019 |
View all notes |
Set NEW NOTE alert |
Company Profile |
SEC
News |
Chart |
Request a new note
C
A
S
I |
ANET
-
NYSE
Arista Networks Inc
TELECOMMUNICATIONS - Communication Equipment
|
$316.90
|
+5.84
1.88% |
$317.07
|
585,549
63.92% of 50 DAV
50 DAV is 916,000
|
$325.00
-2.49%
|
3/13/2019
|
$295.38
|
PP = $313.37
|
|
MB = $329.04
|
Most Recent Note - 4/8/2019 5:00:30 PM
Y - Managed a "positive reversal" today for a gain with lighter than average volume. It rebounded above its pivot point but remains below the "max buy" level previously noted.
>>> FEATURED STOCK ARTICLE : Rebounding Near High After Deep Consolidation - 3/13/2019 |
View all notes |
Set NEW NOTE alert |
Company Profile |
SEC
News |
Chart |
Request a new note
C
A
S
I |
PAYC
-
NYSE
Paycom Software Inc
COMPUTER SOFTWARE and SERVICES - Application Software
|
$184.25
|
+0.77
0.42% |
$184.28
|
617,826
90.72% of 50 DAV
50 DAV is 681,000
|
$193.75
-4.90%
|
2/6/2019
|
$171.66
|
PP = $164.18
|
|
MB = $172.39
|
Most Recent Note - 4/4/2019 3:58:45 PM
G - Pulling back today with above average volume. It did not form a sound new base of sufficient length but stubbornly held its ground. Its 50 DMA line and prior low coincide defining important near-term support to watch in the $169-170 area.
>>> FEATURED STOCK ARTICLE : Consolidating Near All-Time High - 3/8/2019 |
View all notes |
Set NEW NOTE alert |
Company Profile |
SEC
News |
Chart |
Request a new note
C
A
S
I |
PYPL
-
NASDAQ
Paypal Holdings Inc
Finance-CrdtCard/PmtPr
|
$106.57
|
+0.84
0.79% |
$107.00
|
9,244,421
130.29% of 50 DAV
50 DAV is 7,095,000
|
$105.97
0.57%
|
1/24/2019
|
$92.56
|
PP = $93.80
|
|
MB = $98.49
|
Most Recent Note - 4/2/2019 5:53:35 PM
G - Quietly perched at its all-time high, extended from any sound base after gains with lighter than average volume in recent weeks. Its 50 DMA line ($96.62) and prior highs in the $94 area define important near-term support to watch on pullbacks. See the latest FSU analysis for more details and a new annotated graph.
>>> FEATURED STOCK ARTICLE : Extended From Base After Gains in Recent Weeks Lacking Volume - 4/2/2019 |
View all notes |
Set NEW NOTE alert |
Company Profile |
SEC
News |
Chart |
Request a new note
C
A
S
I |
Symbol/Exchange
Company Name
Industry Group |
PRICE |
CHANGE
(%Change) |
Day High |
Volume
(% DAV)
(% 50 day avg vol) |
52 Wk Hi
% From Hi |
Featured
Date |
Price
Featured |
Pivot Featured |
|
Max Buy |
ALRM
-
NASDAQ
Alarm.com Holdings Inc
Security/Sfty
|
$64.82
|
+0.07
0.11% |
$65.33
|
231,652
46.61% of 50 DAV
50 DAV is 497,000
|
$66.44
-2.43%
|
1/22/2019
|
$60.52
|
PP = $60.30
|
|
MB = $63.32
|
Most Recent Note - 4/4/2019 3:57:41 PM
G - Testing its 50 DMA line ($62.61) again with today's loss on higher volume after 5 consecutive gains. Recently reported earnings +12% on +25% sales revenues for the Dec '18 quarter, below the +25% minimum earnings guideline (C criteria), raising fundamental concerns.
>>> FEATURED STOCK ARTICLE : Consolidating Near 50-Day Average Following Sub Par Report - 3/29/2019 |
View all notes |
Set NEW NOTE alert |
Company Profile |
SEC
News |
Chart |
Request a new note
C
A
S
I |
PLNT
-
NYSE
Planet Fitness Inc Cl A
Leisure-Services
|
$70.64
|
-0.83
-1.16% |
$71.29
|
1,516,664
105.18% of 50 DAV
50 DAV is 1,442,000
|
$71.77
-1.57%
|
11/7/2018
|
$57.10
|
PP = $55.45
|
|
MB = $58.22
|
Most Recent Note - 4/5/2019 5:07:29 PM
G - Hit another new all-time high today, getting very extended from any sound base. Its 50 DMA line (62.70) defines near-term support above prior highs in the $59-60 area. Fundamentals remain strong. See the latest FSU analysis for more details and a new annotated graph.
>>> FEATURED STOCK ARTICLE : Perched Near High Very Extended From Prior Base - 4/5/2019 |
View all notes |
Set NEW NOTE alert |
Company Profile |
SEC
News |
Chart |
Request a new note
C
A
S
I |
TEAM
-
NASDAQ
Atlassian Corp Plc Cl A
Comp Sftwr-Spec Enterprs
|
$112.08
|
+0.75
0.67% |
$112.14
|
989,789
68.83% of 50 DAV
50 DAV is 1,438,000
|
$116.70
-3.96%
|
1/7/2019
|
$94.68
|
PP = $98.31
|
|
MB = $103.23
|
Most Recent Note - 4/4/2019 3:54:50 PM
G - Enduring more distributional pressure today and it is extended from any sound base. Its 50 DMA line ($106) and recent low ($99.77 on 3/04/19) define near-term support to watch. Fundamentals remain strong.
>>> FEATURED STOCK ARTICLE : Pullback on Higher Volume After Recent Gains With Less Volume - 3/4/2019 |
View all notes |
Set NEW NOTE alert |
Company Profile |
SEC
News |
Chart |
Request a new note
C
A
S
I |
GLOB
-
NYSE
Globant SA
Computer-Tech Services
|
$73.91
|
-0.69
-0.92% |
$74.84
|
145,341
70.90% of 50 DAV
50 DAV is 205,000
|
$75.96
-2.70%
|
2/15/2019
|
$69.35
|
PP = $70.00
|
|
MB = $73.50
|
Most Recent Note - 4/5/2019 12:39:29 PM
G - Perched at its all-time high. Rose above its "max buy" level with gain backed by above average volume and its color code was changed to green. Found prompt support at its 50 DMA line ($69.97) and above prior lows in the $66-67 area. Violations would raise concerns and trigger technical sell signals.
>>> FEATURED STOCK ARTICLE : Consolidating Near 50-Day Average Quietly Perched Near High - 3/26/2019 |
View all notes |
Set NEW NOTE alert |
Company Profile |
SEC
News |
Chart |
Request a new note
C
A
S
I |
TTD
-
NASDAQ
The Trade Desk Inc Cl A
Comml Svcs-Advertising
|
$197.50
|
+0.98
0.50% |
$197.63
|
994,045
61.06% of 50 DAV
50 DAV is 1,628,000
|
$214.70
-8.01%
|
2/6/2019
|
$148.65
|
PP = $149.00
|
|
MB = $156.45
|
Most Recent Note - 4/4/2019 3:56:03 PM
G - Enduring more distributional pressure today. Its 50 DMA line ($178) defines initial support to watch above the prior high ($161).
>>> FEATURED STOCK ARTICLE : Hit Another New All-Time High Getting Extended From Prior Base - 3/21/2019 |
View all notes |
Set NEW NOTE alert |
Company Profile |
SEC
News |
Chart |
Request a new note
C
A
S
I |
Symbol/Exchange
Company Name
Industry Group |
PRICE |
CHANGE
(%Change) |
Day High |
Volume
(% DAV)
(% 50 day avg vol) |
52 Wk Hi
% From Hi |
Featured
Date |
Price
Featured |
Pivot Featured |
|
Max Buy |