***Last / Change / Volume data in this table is the closing quote data***
Symbol/Exchange
Company Name
Industry Group |
PRICE |
CHANGE
(%Change) |
Day High |
Volume
(% DAV)
(% 50 day avg vol) |
52 Wk Hi
% From Hi |
Featured
Date |
Price
Featured |
Pivot Featured |
|
Max Buy |
MLR
-
NYSE
Miller Industries Inc
AUTOMOTIVE - Auto Parts
|
$32.00
|
+0.13
0.41% |
$32.04
|
26,635
70.09% of 50 DAV
50 DAV is 38,000
|
$35.26
-9.25%
|
11/30/2018
|
$28.35
|
PP = $29.50
|
|
MB = $30.98
|
Most Recent Note - 4/4/2019 4:27:13 PM
G - Rebounded to close above its 50 DMA line ($31.84) helping its outlook to improve. Prior highs in the $29 area define the next near-term support to watch. Reported earnings +17% on +13% sales revenues for the Dec '18 quarter, below the +25% minimum guideline (C criteria), raising fundamental concerns, and it has endured mild distributional pressure in recent weeks.
>>> FEATURED STOCK ARTICLE : Extended From Prior Base After Impressive Streak of Gains - 3/1/2019 |
View all notes |
Set NEW NOTE alert |
Company Profile |
SEC
News |
Chart |
Request a new note
C
A
S
I |
NSP
-
NYSE
Insperity Inc
Comml Svcs-Outsourcing
|
$128.41
|
-0.31
-0.24% |
$130.45
|
245,038
66.59% of 50 DAV
50 DAV is 368,000
|
$132.50
-3.09%
|
2/11/2019
|
$127.91
|
PP = $121.25
|
|
MB = $127.31
|
Most Recent Note - 4/3/2019 5:34:38 PM
G - Color code is changed to green after rising above its "max buy" level again. Found support while consolidating above its 50 DMA line ($120) and near prior highs in the $119-121 area which define important near-term support to watch.
>>> FEATURED STOCK ARTICLE : Volume Totals Cooling and Consolidating Near Prior Highs - 3/14/2019 |
View all notes |
Set NEW NOTE alert |
Company Profile |
SEC
News |
Chart |
Request a new note
C
A
S
I |
ZBRA
-
NASDAQ
Zebra Tech Corp Cl A
COMPUTER HARDWARE - Computer Peripherals
|
$218.33
|
+4.32
2.02% |
$219.66
|
405,865
89.79% of 50 DAV
50 DAV is 452,000
|
$219.39
-0.48%
|
2/14/2019
|
$198.10
|
PP = $184.85
|
|
MB = $194.09
|
Most Recent Note - 4/1/2019 2:18:08 PM
G - Extended from the prior base after wedging higher with recent gains lacking great volume-conviction. Its 50 DMA line ($195) defines near-term support to watch.
>>> FEATURED STOCK ARTICLE : Zebra Extended From Prior Base - 3/25/2019 |
View all notes |
Set NEW NOTE alert |
Company Profile |
SEC
News |
Chart |
Request a new note
C
A
S
I |
SPSC
-
NASDAQ
S P S Commerce Inc
COMPUTER SOFTWARE and SERVICES - Application Software
|
$102.96
|
-0.47
-0.45% |
$103.83
|
109,400
71.97% of 50 DAV
50 DAV is 152,000
|
$113.31
-9.13%
|
3/26/2019
|
$107.12
|
PP = $113.41
|
|
MB = $119.08
|
Most Recent Note - 4/2/2019 5:55:18 PM
Y - Still consolidating in an orderly fashion well above prior highs in the $100 area defining support to watch along with its 50 DMA line ($101.34). Subsequent gains above the pivot point backed by at least +40% above average volume may trigger a new (or add-on) technical buy signal.
>>> FEATURED STOCK ARTICLE : Consolidating in Orderly Fashion Above Prior Highs - 3/22/2019 |
View all notes |
Set NEW NOTE alert |
Company Profile |
SEC
News |
Chart |
Request a new note
C
A
S
I |
SSNC
-
NASDAQ
S S & C Technologies
COMPUTER SOFTWARE and SERVICES - Application Software
|
$63.64
|
+0.41
0.65% |
$63.83
|
962,022
53.74% of 50 DAV
50 DAV is 1,790,000
|
$65.19
-2.38%
|
2/15/2019
|
$59.73
|
PP = $61.07
|
|
MB = $64.12
|
Most Recent Note - 4/4/2019 5:06:26 PM
Y - Still above its pivot point and below its "max buy" level, remaining perched near its all-time high. Its 50 DMA line ($58.93) and prior low define near term support to watch.
>>> FEATURED STOCK ARTICLE : Hovering Near High With Volume Totals Cooling in Recent Weeks - 3/27/2019 |
View all notes |
Set NEW NOTE alert |
Company Profile |
SEC
News |
Chart |
Request a new note
C
A
S
I |
Symbol/Exchange
Company Name
Industry Group |
PRICE |
CHANGE
(%Change) |
Day High |
Volume
(% DAV)
(% 50 day avg vol) |
52 Wk Hi
% From Hi |
Featured
Date |
Price
Featured |
Pivot Featured |
|
Max Buy |
IRBT
-
NASDAQ
Irobot Corp
CONSUMER DURABLES - Electronic Equipment
|
$124.36
|
+2.77
2.28% |
$124.89
|
599,047
69.01% of 50 DAV
50 DAV is 868,000
|
$132.88
-6.41%
|
2/8/2019
|
$104.92
|
PP = $103.63
|
|
MB = $108.81
|
Most Recent Note - 4/2/2019 6:04:36 PM
G - Tallied 4 consecutive gains with lighter than average volume. Found prompt support near its August '18 high on the pullback. Its 50 DMA line ($112.55) defines important near-term support while possibly building a new base.
>>> FEATURED STOCK ARTICLE : Consolidating After Getting Extended from Double Bottom Base - 3/12/2019 |
View all notes |
Set NEW NOTE alert |
Company Profile |
SEC
News |
Chart |
Request a new note
C
A
S
I |
AUDC
-
NASDAQ
Audiocodes Ltd
ELECTRONICS - Scientific and Technical Instrum
|
$15.62
|
+0.29
1.89% |
$15.75
|
205,172
79.83% of 50 DAV
50 DAV is 257,000
|
$16.36
-4.49%
|
3/20/2019
|
$13.66
|
PP = $15.06
|
|
MB = $15.81
|
Most Recent Note - 4/3/2019 12:16:00 PM
Y - Hitting a new 52-week high and today's early gain has it near +5% above its pivot point. Big gain on the prior session backed by +166% above average volume triggered a technical buy signal. Prior lows in the $12.50 area define important near-term support below its 50 DMA line.
>>> FEATURED STOCK ARTICLE : Building a Base and Found Support Near 50-Day Moving Average - 3/20/2019 |
View all notes |
Set NEW NOTE alert |
Company Profile |
SEC
News |
Chart |
Request a new note
C
A
S
I |
ENV
-
NYSE
Envestnet Inc
FINANCIAL SERVICES - Diversified Investments
|
$66.12
|
+0.87
1.33% |
$66.15
|
333,347
120.34% of 50 DAV
50 DAV is 277,000
|
$67.52
-2.07%
|
3/15/2019
|
$66.05
|
PP = $64.90
|
|
MB = $68.15
|
Most Recent Note - 4/4/2019 4:01:21 PM
Y - Hovering near its all-time high. Stalled after its technical breakout was noted on 3/15/19. More damaging losses below the recent low ($63.34 on 3/27/19) would raise greater concerns.
>>> FEATURED STOCK ARTICLE : Volume Heavy Behind Rally to New Highs - 3/15/2019 |
View all notes |
Set NEW NOTE alert |
Company Profile |
SEC
News |
Chart |
Request a new note
C
A
S
I |
LHCG
-
NASDAQ
L H C Group Inc
HEALTH SERVICES - Home Health Care
|
$110.85
|
+2.67
2.47% |
$111.75
|
195,432
81.43% of 50 DAV
50 DAV is 240,000
|
$115.54
-4.06%
|
1/23/2019
|
$107.29
|
PP = $107.61
|
|
MB = $112.99
|
 Most Recent Note - 4/5/2019 5:11:05 PM
Y - Posted a solid gain today with near average volume, finding support while consolidating near its 50 DMA line ($109.37). Prior lows define the next important near-term support above its 200 DMA line.
>>> FEATURED STOCK ARTICLE : Sputtering Near 50-Day Moving Average Line - 4/1/2019 |
View all notes |
Set NEW NOTE alert |
Company Profile |
SEC
News |
Chart |
Request a new note
C
A
S
I |
ENSG
-
NASDAQ
Ensign Group Inc
HEALTH SERVICES - Long-Term Care Facilities
|
$52.46
|
+1.26
2.46% |
$53.30
|
310,195
99.10% of 50 DAV
50 DAV is 313,000
|
$54.56
-3.85%
|
2/7/2019
|
$48.71
|
PP = $49.06
|
|
MB = $51.51
|
Most Recent Note - 4/5/2019 5:09:32 PM
G - Color code is changed to green after a volume-driven gain lifted it above the "max buy" level. Found support near prior highs in the $48 area and above its 50 DMA line ($49.11) defining the important near-term support.
>>> FEATURED STOCK ARTICLE : Consolidating Near Proir High and Above 50-Day Average - 3/11/2019 |
View all notes |
Set NEW NOTE alert |
Company Profile |
SEC
News |
Chart |
Request a new note
C
A
S
I |
Symbol/Exchange
Company Name
Industry Group |
PRICE |
CHANGE
(%Change) |
Day High |
Volume
(% DAV)
(% 50 day avg vol) |
52 Wk Hi
% From Hi |
Featured
Date |
Price
Featured |
Pivot Featured |
|
Max Buy |
LULU
-
NASDAQ
Lululemon Athletica
MANUFACTURING - Textile Manufacturing
|
$169.37
|
-2.00
-1.17% |
$172.90
|
1,942,136
85.56% of 50 DAV
50 DAV is 2,270,000
|
$171.69
-1.35%
|
3/28/2019
|
$169.20
|
PP = $164.89
|
|
MB = $173.13
|
Most Recent Note - 4/1/2019 1:25:31 PM
Y - Consolidating after a "breakaway gap" on 3/28/19 triggered a technical buy signal. Bullish action came after it reported Jan '19 earnings +39% on +26% sales revenues, marking its 5th consecutive quarterly comparison above the +25% minimum guideline (C criteria). See the latest FSU analysis for more details and an annotated graph.
>>> FEATURED STOCK ARTICLE : Breakway Gap Backed by More Than 6 Times Average Volume - 3/28/2019 |
View all notes |
Set NEW NOTE alert |
Company Profile |
SEC
News |
Chart |
Request a new note
C
A
S
I |
NXST
-
NASDAQ
Nexstar Media Group Cl A
MEDIA - Broadcasting - TV
|
$112.73
|
+0.54
0.48% |
$113.68
|
577,603
108.57% of 50 DAV
50 DAV is 532,000
|
$112.23
0.45%
|
2/26/2019
|
$94.26
|
PP = $89.76
|
|
MB = $94.25
|
Most Recent Note - 4/4/2019 5:04:09 PM
G - Hit another new all-time high today, very extended from any sound base. Disciplined investors avoid chasing stocks more than +5% above the prior high. See the latest FSU analysis for more details and a new annotated graph.
>>> FEATURED STOCK ARTICLE : Hitting New High and Very Extended From Prior Base - 4/4/2019 |
View all notes |
Set NEW NOTE alert |
Company Profile |
SEC
News |
Chart |
Request a new note
C
A
S
I |
ULTA
-
NASDAQ
Ulta Beauty Inc
SPECIALTY RETAIL - Specialty Retail, Other
|
$353.63
|
+3.49
1.00% |
$354.18
|
579,809
74.72% of 50 DAV
50 DAV is 776,000
|
$354.44
-0.23%
|
3/15/2019
|
$341.27
|
PP = $322.59
|
|
MB = $338.72
|
Most Recent Note - 4/4/2019 5:09:07 PM
G - Color code is changed to green while perched above its "max buy" level. Volume totals have been cooling while stubbornly holding its ground near its all-time high. Bullish action came after it reported earnings +31% sales revenues on +10% sales revenues for the Jan '19 quarter.
>>> FEATURED STOCK ARTICLE : Consolidating Following Big "Breakaway Gap" - 3/19/2019 |
View all notes |
Set NEW NOTE alert |
Company Profile |
SEC
News |
Chart |
Request a new note
C
A
S
I |
UBNT
-
NASDAQ
Ubiquiti Networks
TELECOMMUNICATIONS - Diversified Communication Serv
|
$162.19
|
+3.00
1.88% |
$163.24
|
307,322
80.24% of 50 DAV
50 DAV is 383,000
|
$162.73
-0.33%
|
2/8/2019
|
$121.97
|
PP = $115.54
|
|
MB = $121.32
|
Most Recent Note - 4/2/2019 6:09:25 PM
G - Hit yet another new all-time high with today's 4th consecutive volume-driven gain. It did not form a sound base of sufficient length but held its ground stubbornly after a big rally. Its prior low ($136.08 on 3/08/19) and 50 DMA line ($133.51) define near-term support to watch. Fundamentals remain strong.
>>> FEATURED STOCK ARTICLE : Bullish Action Came Following Another Strong Earnings Report - 3/5/2019 |
View all notes |
Set NEW NOTE alert |
Company Profile |
SEC
News |
Chart |
Request a new note
C
A
S
I |
ESNT
-
NYSE
Essent Group Ltd
Finance-MrtgandRel Svc
|
$45.80
|
+0.19
0.42% |
$45.80
|
250,565
40.41% of 50 DAV
50 DAV is 620,000
|
$47.94
-4.46%
|
3/18/2019
|
$45.84
|
PP = $45.06
|
|
MB = $47.31
|
Most Recent Note - 4/1/2019 2:16:38 PM
Y - Found support above its 50 DMA line defining important near-term support in the $42 area. Raised concerns when weakness negated the recent breakout and it was repeatedly noted - "Faces some resistance due to overhead supply up to the $50 level."
>>> FEATURED STOCK ARTICLE : Big Breakout Gain With +350% Above Average Volume - 3/18/2019 |
View all notes |
Set NEW NOTE alert |
Company Profile |
SEC
News |
Chart |
Request a new note
C
A
S
I |
Symbol/Exchange
Company Name
Industry Group |
PRICE |
CHANGE
(%Change) |
Day High |
Volume
(% DAV)
(% 50 day avg vol) |
52 Wk Hi
% From Hi |
Featured
Date |
Price
Featured |
Pivot Featured |
|
Max Buy |
NOW
-
NYSE
Servicenow Inc
Computer Sftwr-Enterprse
|
$236.98
|
-0.05
-0.02% |
$240.09
|
1,157,241
55.53% of 50 DAV
50 DAV is 2,084,000
|
$251.65
-5.83%
|
1/31/2019
|
$218.14
|
PP = $206.40
|
|
MB = $216.72
|
Most Recent Note - 4/4/2019 1:01:17 PM
G - Testing its 50 DMA line ($231.88) with today's big loss on above average volume. Below that important short-term average the recent low ($226.71 on 3/08/19) defines near-term support to watch. More damaging losses would raise concerns and trigger technical sell signals.
>>> FEATURED STOCK ARTICLE : Pulling Back After 6 Straight Weekly Gains - 3/6/2019 |
View all notes |
Set NEW NOTE alert |
Company Profile |
SEC
News |
Chart |
Request a new note
C
A
S
I |
PANW
-
NYSE
Palo Alto Networks
Computer Sftwr-Security
|
$238.85
|
+1.78
0.75% |
$240.42
|
1,248,345
88.41% of 50 DAV
50 DAV is 1,412,000
|
$260.63
-8.36%
|
2/25/2019
|
$233.54
|
PP = $239.60
|
|
MB = $251.58
|
Most Recent Note - 4/3/2019 5:33:10 PM
Y - Volume totals have been cooling while still consolidating above its prior low and above its 50 DMA line defining important support to watch in the $230 area. Fundamentals remain strong. See the latest FSU analysis for more details and a new annotated graph.
>>> FEATURED STOCK ARTICLE : Consolidating Above Prior High and 50-Day Average - 4/3/2019 |
View all notes |
Set NEW NOTE alert |
Company Profile |
SEC
News |
Chart |
Request a new note
C
A
S
I |
ANET
-
NYSE
Arista Networks Inc
TELECOMMUNICATIONS - Communication Equipment
|
$311.06
|
-2.09
-0.67% |
$315.94
|
866,737
95.56% of 50 DAV
50 DAV is 907,000
|
$325.00
-4.29%
|
3/13/2019
|
$295.38
|
PP = $313.37
|
|
MB = $329.04
|
Most Recent Note - 4/2/2019 6:02:10 PM
Y - Inched into new high territory with lighter than average volume behind today's 7th consecutive gain. It rebounded above its pivot point but remains below the "max buy" level previously noted.
>>> FEATURED STOCK ARTICLE : Rebounding Near High After Deep Consolidation - 3/13/2019 |
View all notes |
Set NEW NOTE alert |
Company Profile |
SEC
News |
Chart |
Request a new note
C
A
S
I |
PAYC
-
NYSE
Paycom Software Inc
COMPUTER SOFTWARE and SERVICES - Application Software
|
$183.48
|
-0.21
-0.11% |
$185.78
|
514,621
75.24% of 50 DAV
50 DAV is 684,000
|
$193.75
-5.30%
|
2/6/2019
|
$171.66
|
PP = $164.18
|
|
MB = $172.39
|
Most Recent Note - 4/4/2019 3:58:45 PM
G - Pulling back today with above average volume. It did not form a sound new base of sufficient length but stubbornly held its ground. Its 50 DMA line and prior low coincide defining important near-term support to watch in the $169-170 area.
>>> FEATURED STOCK ARTICLE : Consolidating Near All-Time High - 3/8/2019 |
View all notes |
Set NEW NOTE alert |
Company Profile |
SEC
News |
Chart |
Request a new note
C
A
S
I |
PYPL
-
NASDAQ
Paypal Holdings Inc
Finance-CrdtCard/PmtPr
|
$105.73
|
+1.27
1.22% |
$105.80
|
8,457,894
118.81% of 50 DAV
50 DAV is 7,119,000
|
$105.97
-0.23%
|
1/24/2019
|
$92.56
|
PP = $93.80
|
|
MB = $98.49
|
Most Recent Note - 4/2/2019 5:53:35 PM
G - Quietly perched at its all-time high, extended from any sound base after gains with lighter than average volume in recent weeks. Its 50 DMA line ($96.62) and prior highs in the $94 area define important near-term support to watch on pullbacks. See the latest FSU analysis for more details and a new annotated graph.
>>> FEATURED STOCK ARTICLE : Extended From Base After Gains in Recent Weeks Lacking Volume - 4/2/2019 |
View all notes |
Set NEW NOTE alert |
Company Profile |
SEC
News |
Chart |
Request a new note
C
A
S
I |
Symbol/Exchange
Company Name
Industry Group |
PRICE |
CHANGE
(%Change) |
Day High |
Volume
(% DAV)
(% 50 day avg vol) |
52 Wk Hi
% From Hi |
Featured
Date |
Price
Featured |
Pivot Featured |
|
Max Buy |
ALRM
-
NASDAQ
Alarm.com Holdings Inc
Security/Sfty
|
$64.75
|
+0.97
1.52% |
$65.06
|
457,493
92.24% of 50 DAV
50 DAV is 496,000
|
$66.44
-2.54%
|
1/22/2019
|
$60.52
|
PP = $60.30
|
|
MB = $63.32
|
Most Recent Note - 4/4/2019 3:57:41 PM
G - Testing its 50 DMA line ($62.61) again with today's loss on higher volume after 5 consecutive gains. Recently reported earnings +12% on +25% sales revenues for the Dec '18 quarter, below the +25% minimum earnings guideline (C criteria), raising fundamental concerns.
>>> FEATURED STOCK ARTICLE : Consolidating Near 50-Day Average Following Sub Par Report - 3/29/2019 |
View all notes |
Set NEW NOTE alert |
Company Profile |
SEC
News |
Chart |
Request a new note
C
A
S
I |
PLNT
-
NYSE
Planet Fitness Inc Cl A
Leisure-Services
|
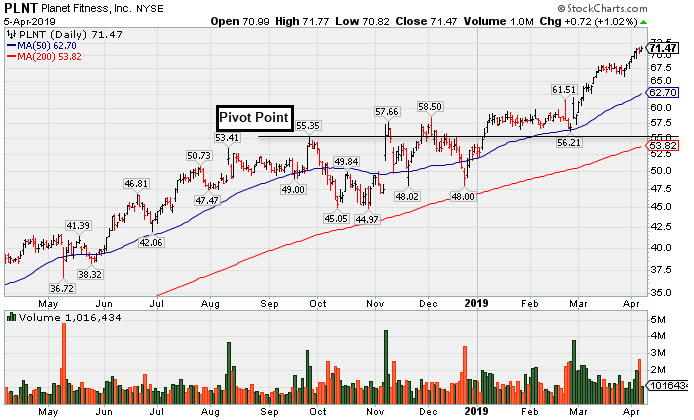
$71.47
|
+0.72
1.02% |
$71.77
|
1,010,725
70.93% of 50 DAV
50 DAV is 1,425,000
|
$71.64
-0.24%
|
11/7/2018
|
$57.10
|
PP = $55.45
|
|
MB = $58.22
|
Most Recent Note - 4/5/2019 5:07:29 PM
G - Hit another new all-time high today, getting very extended from any sound base. Its 50 DMA line (62.70) defines near-term support above prior highs in the $59-60 area. Fundamentals remain strong. See the latest FSU analysis for more details and a new annotated graph.
>>> FEATURED STOCK ARTICLE : Perched Near High Very Extended From Prior Base - 4/5/2019 |
View all notes |
Set NEW NOTE alert |
Company Profile |
SEC
News |
Chart |
Request a new note
C
A
S
I |
TEAM
-
NASDAQ
Atlassian Corp Plc Cl A
Comp Sftwr-Spec Enterprs
|
$111.33
|
+1.11
1.01% |
$112.54
|
1,219,187
84.78% of 50 DAV
50 DAV is 1,438,000
|
$116.70
-4.60%
|
1/7/2019
|
$94.68
|
PP = $98.31
|
|
MB = $103.23
|
Most Recent Note - 4/4/2019 3:54:50 PM
G - Enduring more distributional pressure today and it is extended from any sound base. Its 50 DMA line ($106) and recent low ($99.77 on 3/04/19) define near-term support to watch. Fundamentals remain strong.
>>> FEATURED STOCK ARTICLE : Pullback on Higher Volume After Recent Gains With Less Volume - 3/4/2019 |
View all notes |
Set NEW NOTE alert |
Company Profile |
SEC
News |
Chart |
Request a new note
C
A
S
I |
GLOB
-
NYSE
Globant SA
Computer-Tech Services
|
$74.60
|
+2.58
3.58% |
$75.96
|
475,443
240.12% of 50 DAV
50 DAV is 198,000
|
$75.23
-0.84%
|
2/15/2019
|
$69.35
|
PP = $70.00
|
|
MB = $73.50
|
Most Recent Note - 4/5/2019 12:39:29 PM
G - Perched at its all-time high. Rose above its "max buy" level with gain backed by above average volume and its color code was changed to green. Found prompt support at its 50 DMA line ($69.97) and above prior lows in the $66-67 area. Violations would raise concerns and trigger technical sell signals.
>>> FEATURED STOCK ARTICLE : Consolidating Near 50-Day Average Quietly Perched Near High - 3/26/2019 |
View all notes |
Set NEW NOTE alert |
Company Profile |
SEC
News |
Chart |
Request a new note
C
A
S
I |
TTD
-
NASDAQ
The Trade Desk Inc Cl A
Comml Svcs-Advertising
|
$196.52
|
-1.48
-0.75% |
$200.00
|
997,785
61.63% of 50 DAV
50 DAV is 1,619,000
|
$214.70
-8.47%
|
2/6/2019
|
$148.65
|
PP = $149.00
|
|
MB = $156.45
|
Most Recent Note - 4/4/2019 3:56:03 PM
G - Enduring more distributional pressure today. Its 50 DMA line ($178) defines initial support to watch above the prior high ($161).
>>> FEATURED STOCK ARTICLE : Hit Another New All-Time High Getting Extended From Prior Base - 3/21/2019 |
View all notes |
Set NEW NOTE alert |
Company Profile |
SEC
News |
Chart |
Request a new note
C
A
S
I |
Symbol/Exchange
Company Name
Industry Group |
PRICE |
CHANGE
(%Change) |
Day High |
Volume
(% DAV)
(% 50 day avg vol) |
52 Wk Hi
% From Hi |
Featured
Date |
Price
Featured |
Pivot Featured |
|
Max Buy |