You are not logged in.
This means you
CAN ONLY VIEW reports that were published prior to Friday, February 23, 2024.
You
MUST UPGRADE YOUR MEMBERSHIP if you want to see any current reports.
AFTER MARKET UPDATE - MONDAY, APRIL 4TH, 2022
Previous After Market Report Next After Market Report >>>
|
|
|
|
DOW |
+103.61 |
34,921.88 |
+0.30% |
|
Volume |
917,353,779 |
-8% |
|
Volume |
4,513,431,900 |
-9% |
|
NASDAQ |
+271.05 |
14,532.55 |
+1.90% |
|
Advancers |
1,812 |
55% |
|
Advancers |
2,868 |
61% |
|
S&P 500 |
+36.78 |
4,582.64 |
+0.81% |
|
Decliners |
1,489 |
45% |
|
Decliners |
1,795 |
38% |
|
Russell 2000 |
+4.33 |
2,095.44 |
+0.21% |
|
52 Wk Highs |
99 |
|
|
52 Wk Highs |
81 |
|
|
S&P 600 |
-5.01 |
1,326.33 |
-0.38% |
|
52 Wk Lows |
47 |
|
|
52 Wk Lows |
80 |
|
|
 |
Major Indices Rose With Lighter Volume Totals
Kenneth J. Gruneisen - Passed the CAN SLIM® Master's Exam
The Nasdaq Composite surged 1.9%, climbing out of correction territory (defined as a 10% decline from a recent peak). The S&P 500 advanced 0.8%, back within 4.5% of its January 3 record. Both benchmarks just notched their first three-week winning streak since November. The Dow added 103 points. Volume totals reported were lighter than the prior session on the NYSE and on the Nasdaq exchange, revealing lackluster institutional buying demand. Breadth was positive as advancers led decliners by a 6-5 margin on the NYSE and 302 on the Nasdaq exchange. There were 29 high-ranked companies from the Leaders List that hit new 52-week highs and were listed on the BreakOuts Page, versus the total of 29 on the prior session. New 52-week highs outnumbered new 52-week lows by 2-1 on the NYSE while the highs/lows totals were nearly even on the Nasdaq exchange. The recently noted follow-through day confirmed a new uptrend (M criteria). Strict followers of the fact-based investment system only buy stocks fitting all key fundamental and technical investment criteria.
Chart courtesy of www.stockcharts.com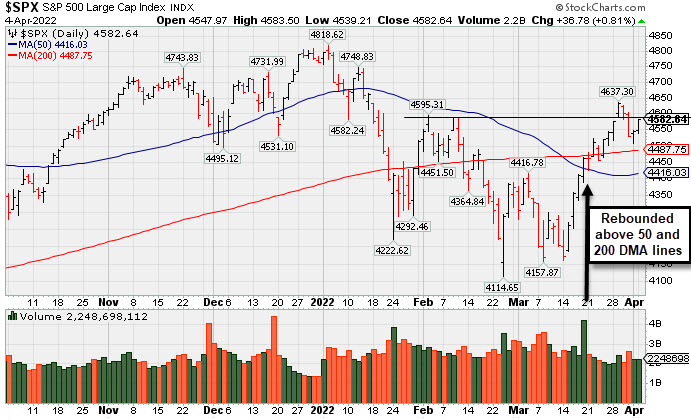 PICTURED: The S&P 500 Index rebounded above its 50-day and 200-day moving average (DMA) lines and made additional progress in recent weeks.
U.S. stocks finished higher on Monday amid a relief rally in recently beleaguered tech and growth-related shares. In commodities, West Texas Intermediate crude rebounded 4.3% to $103.54/barrel following its worst week since April 2020.
Seven of 11 S&P 500 sectors closed in negative territory, with Utilities and Health Care the worst performers. Consumer Discretionary, Communication Services, and Technology were the standouts, amid strength in mega-cap shares. In corporate news, Twitter Inc. (TWTR +27.12%) soared after Tesla Inc.’s Chief Executive Officer (CEO) Elon Musk reported a 9.2% stake in the company. Meanwhile, shares of Tesla Inc. (TSLA +5.61%) after posting record vehicle deliveries during the first quarter. Elsewhere, Starbucks Corp. (SBUX -3.72%) following a decision to suspend its stock buyback program in order to increase spending on its stores and employees.
Meanwhile, Wall Street continued to monitor an inverting Treasury yield curve. The yield on the two-year note was down four basis points (0.04%) to 2.41%, still higher than the 10-year note yield, which advanced three basis points (0.03%) to 2.40%. This week, the release of the Fed’s March meeting minutes will headline the economic slate on Wednesday. On the data front today, factory orders dipped 0.5% in February, while final readings confirmed both durable and capital goods orders declined during the month.
|
 Kenneth J. Gruneisen started out as a licensed stockbroker in August 1987, a couple of months prior to the historic stock market crash that took the Dow Jones Industrial Average down -22.6% in a single day. He has published daily fact-based fundamental and technical analysis on high-ranked stocks online for two decades. Through FACTBASEDINVESTING.COM, Kenneth provides educational articles, news, market commentary, and other information regarding proven investment systems that work in good times and bad.
Comments contained in the body of this report are technical opinions only and are not necessarily those of Gruneisen Growth Corp. The material herein has been obtained from sources believed to be reliable and accurate, however, its accuracy and completeness cannot be guaranteed. Our firm, employees, and customers may effect transactions, including transactions contrary to any recommendation herein, or have positions in the securities mentioned herein or options with respect thereto. Any recommendation contained in this report may not be suitable for all investors and it is not to be deemed an offer or solicitation on our part with respect to the purchase or sale of any securities. |
|
 |
Retail and Tech Indexes Posted Influential Gains
Kenneth J. Gruneisen - Passed the CAN SLIM® Master's Exam
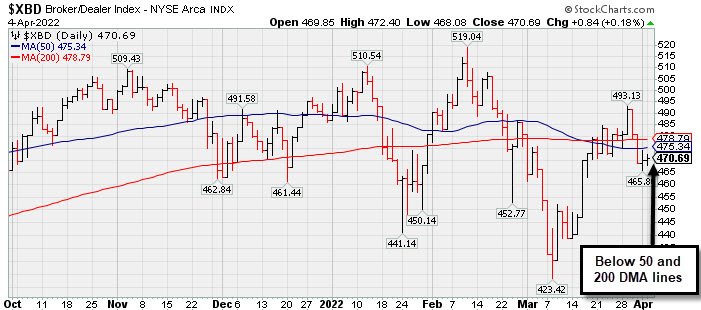
The Retail Index ($RLX +2.28%) posted an influential gain on Monday, and the tech sector had a positive bias as the Semiconductor Index ($SOX +1.73%), Networking Index ($NWX +1.00%), and Biotech Index ($BTK +0.93%) each gained ground. The Bank Index ($BKX -0.02%) and Broker/Dealer Index ($XBD +0.18%) both were little changed. The Gold & Silver Index ($XAU -0.58%) edged lower while the Oil Services Index ($OSX +0.36%) and Integrated Oil Index ($XOI +0.36%) each edged higher. PICTURED: The Broker/Dealer Index ($XBD +0.18%) is sputtering back below its 50-day and 200-day moving average (DMA) lines after recently making limited headway above them. Further technical weakness in the Broker/Dealer Index bodes poorly for the broader market outlook, as longtime readers should recognize the reliability of financial indexes as "leading indicators".
| Oil Services |
$OSX |
82.02 |
+0.30 |
+0.36% |
+55.58% |
| Integrated Oil |
$XOI |
1,595.73 |
+5.78 |
+0.36% |
+35.44% |
| Semiconductor |
$SOX |
3,424.95 |
+58.31 |
+1.73% |
-13.21% |
| Networking |
$NWX |
902.61 |
+8.92 |
+1.00% |
-7.05% |
| Broker/Dealer |
$XBD |
470.69 |
+0.84 |
+0.18% |
-3.32% |
| Retail |
$RLX |
3,896.49 |
+86.86 |
+2.28% |
-7.81% |
| Gold & Silver |
$XAU |
162.25 |
-0.94 |
-0.58% |
+22.50% |
| Bank |
$BKX |
122.56 |
-0.02 |
-0.02% |
-7.31% |
| Biotech |
$BTK |
5,283.17 |
+48.77 |
+0.93% |
-4.26% |
|
|
|
 |
Volume Totals Have Been Light While Hovering at All-Time High
Kenneth J. Gruneisen - Passed the CAN SLIM® Master's Exam
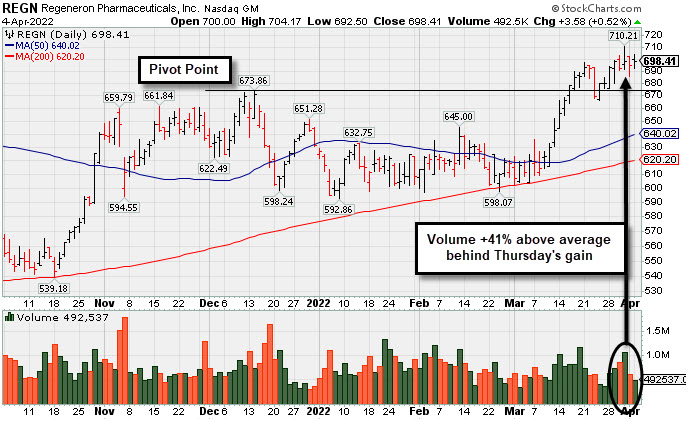
Regeneron Pharmaceuticals Inc (REGN +$3.58 or +0.52% to $698.41) has seen lighter volume totals while hovering near its all-time high after last Thursday's noted gain backed by +41% above average volume. Its 50-day moving average (DMA) line ($640) defines important near-term support to watch on pullbacks. It is still less than +5% above the pivot point, not too extended from a sound base pattern.
REGN found support above its 200 DMA line ($620) during its consolidation in recent months and its color code was changed to yellow with new pivot point cited based on its 12/14/21 high plus 10 cents. It has made gradual progress since last covered in greater detail on 3/16/22 with an annotated graph under the headline, "6th Straight Gain Leaves Regeneron Near Record High".
The high-ranked DRUGS - Biotechnology firm reported earnings +149% on +104% sales revenues for the Dec '21 quarter versus the year ago period. That marked its 6th quarterly comparison above the +25% minimum earnings guideline (C criteria) and with a strong sales revenues growth rate. Its annual earnings (A criteria) growth has been strong. It has a highest possible 99 Earnings Per Share Rating.
There are 2,738 top-rated funds that own its shares as of Dec '21, up from 2,376 in Dec '20, a reassuring sign concerning the I criteria. Its current Up/Down Volume Ratio of 1.7 is an unbiased indication its shares have been under slight accumulation over the past 50 days. REGN completed a Secondary Offering on 5/28/20. There are 97.1 million shares in the public float (S criteria) which can contribute to greater volatility in the event of institutional buying or selling.
|
|
|
Color Codes Explained :
Y - Better candidates highlighted by our
staff of experts.
G - Previously featured
in past reports as yellow but may no longer be buyable under the
guidelines.
***Last / Change / Volume data in this table is the closing quote data***
Symbol/Exchange
Company Name
Industry Group |
PRICE |
CHANGE
(%Change) |
Day High |
Volume
(% DAV)
(% 50 day avg vol) |
52 Wk Hi
% From Hi |
Featured
Date |
Price
Featured |
Pivot Featured |
|
Max Buy |
 REGN
-
NASDAQ
REGN
-
NASDAQ
Regeneron Pharmaceutical
DRUGS - Biotechnology
|
$698.41
|
+3.58
0.52% |
$704.17
|
492,537
65.50% of 50 DAV
50 DAV is 752,000
|
$710.21
-1.66%
|
3/14/2022
|
$647.95
|
PP = $673.96
|
|
MB = $707.66
|
 Most Recent Note - 4/4/2022 5:35:18 PM
Y - Volume totals have been very light after last Thursday's noted gain backed by +41% above average volume. Remains trading below the "max buy" level yet perched near its all-time high. Its 50 DMA line ($640) defines important near-term support to watch on pullbacks. See the latest FSU analysis for more detailed analysis and a new annotated graph.
>>> FEATURED STOCK ARTICLE : Volume Totals Have Been Light While Hovering at All-Time High - 4/4/2022 |
View all notes |
Set NEW NOTE alert |
Company Profile |
SEC
News |
Chart |
Request a new note
C
A
S
I |
TGH
-
NYSE
Textainer Group Holdings
TRANSPORTATION - Logistics
|
$37.26
|
-1.23
-3.20% |
$38.20
|
491,232
105.64% of 50 DAV
50 DAV is 465,000
|
$41.89
-11.05%
|
1/31/2022
|
$36.68
|
PP = $41.34
|
|
MB = $43.41
|
Most Recent Note - 4/4/2022 5:38:18 PM
G - Color code is changed to green after today's loss on average volume while slumping below its 50 DMA line ($37.79). Only a prompt rebound above the 50 DMA line woud help its outlook improve, meanwhile any further deterioration raises greater concerns. Its 200 DMA line ($35.54) and prior lows define the next important support to watch.
>>> FEATURED STOCK ARTICLE : Recently Perched Within Striking Distance of Prior Highs - 3/30/2022 |
View all notes |
Set NEW NOTE alert |
Company Profile |
SEC
News |
Chart |
Request a new note
C
A
S
I |
HWKN
-
NASDAQ
Hawkins Inc
CHEMICALS - Basic Chemicals
|
$43.99
|
-1.71
-3.74% |
$45.74
|
101,963
132.42% of 50 DAV
50 DAV is 77,000
|
$48.12
-8.58%
|
2/3/2022
|
$39.81
|
PP = $41.07
|
|
MB = $43.12
|
Most Recent Note - 4/4/2022 5:31:35 PM
G - Suffered a 3rd consecutive loss with above average volume after a noted "negative reversal" at its all-time high last. Its 50 DMA line ($43.12) defines near-term support to watch.
>>> FEATURED STOCK ARTICLE : Hovering Near High After Rising From Prior Base - 3/15/2022 |
View all notes |
Set NEW NOTE alert |
Company Profile |
SEC
News |
Chart |
Request a new note
C
A
S
I |
IMXI
-
NASDAQ
International Money Exp
Financial Svcs-Specialty
|
$21.52
|
+0.51
2.43% |
$21.54
|
218,532
64.65% of 50 DAV
50 DAV is 338,000
|
$21.98
-2.09%
|
3/8/2022
|
$18.64
|
PP = $19.06
|
|
MB = $20.01
|
Most Recent Note - 4/4/2022 5:32:40 PM
G - Posted a quiet gain today, still in a very tight range and stubbornly holding its ground. Prior highs in the high $18 area define initial support to watch.
>>> FEATURED STOCK ARTICLE : Holding Ground After Rallying From Prior Base - 3/24/2022 |
View all notes |
Set NEW NOTE alert |
Company Profile |
SEC
News |
Chart |
Request a new note
C
A
S
I |
|
|
|
THESE ARE NOT BUY RECOMMENDATIONS!
Comments contained in the body of this report are technical
opinions only. The material herein has been obtained
from sources believed to be reliable and accurate, however,
its accuracy and completeness cannot be guaranteed.
This site is not an investment advisor, hence it does
not endorse or recommend any securities or other investments.
Any recommendation contained in this report may not
be suitable for all investors and it is not to be deemed
an offer or solicitation on our part with respect to
the purchase or sale of any securities. All trademarks,
service marks and trade names appearing in this report
are the property of their respective owners, and are
likewise used for identification purposes only.
This report is a service available
only to active Paid Premium Members.
You may opt-out of receiving report notifications
at any time. Questions or comments may be submitted
by writing to Premium Membership Services 665 S.E. 10 Street, Suite 201 Deerfield Beach, FL 33441-5634 or by calling 1-800-965-8307
or 954-785-1121.
|
|
|