***Last / Change / Volume data in this table is the closing quote data***
Symbol/Exchange
Company Name
Industry Group |
PRICE |
CHANGE
(%Change) |
Day High |
Volume
(% DAV)
(% 50 day avg vol) |
52 Wk Hi
% From Hi |
Featured
Date |
Price
Featured |
Pivot Featured |
|
Max Buy |
MLR
-
NYSE
Miller Industries Inc
AUTOMOTIVE - Auto Parts
|
$31.06
|
+0.06
0.19% |
$31.32
|
57,781
156.16% of 50 DAV
50 DAV is 37,000
|
$35.26
-11.91%
|
11/30/2018
|
$28.35
|
PP = $29.50
|
|
MB = $30.98
|
Most Recent Note - 3/28/2019 1:03:31 PM
G - Sputtering below its 50 DMA line ($31.62) for a week. A rebound above the 50 DMA line is needed for its outlook to improve. Prior highs in the $29 area define the next near-term support to watch. Reported earnings +17% on +13% sales revenues for the Dec '18 quarter, below the +25% minimum guideline (C criteria), raising fundamental concerns, and it has endured mild distributional pressure in recent weeks.
>>> FEATURED STOCK ARTICLE : Extended From Prior Base After Impressive Streak of Gains - 3/1/2019 |
View all notes |
Set NEW NOTE alert |
Company Profile |
SEC
News |
Chart |
Request a new note
C
A
S
I |
NSP
-
NYSE
Insperity Inc
Comml Svcs-Outsourcing
|
$129.57
|
+3.29
2.61% |
$129.77
|
419,288
114.87% of 50 DAV
50 DAV is 365,000
|
$132.50
-2.21%
|
2/11/2019
|
$127.91
|
PP = $121.25
|
|
MB = $127.31
|
 Most Recent Note - 4/3/2019 5:34:38 PM
G - Color code is changed to green after rising above its "max buy" level again. Found support while consolidating above its 50 DMA line ($120) and near prior highs in the $119-121 area which define important near-term support to watch.
>>> FEATURED STOCK ARTICLE : Volume Totals Cooling and Consolidating Near Prior Highs - 3/14/2019 |
View all notes |
Set NEW NOTE alert |
Company Profile |
SEC
News |
Chart |
Request a new note
C
A
S
I |
ZBRA
-
NASDAQ
Zebra Tech Corp Cl A
COMPUTER HARDWARE - Computer Peripherals
|
$215.04
|
+1.42
0.66% |
$218.59
|
308,006
67.69% of 50 DAV
50 DAV is 455,000
|
$219.39
-1.98%
|
2/14/2019
|
$198.10
|
PP = $184.85
|
|
MB = $194.09
|
Most Recent Note - 4/1/2019 2:18:08 PM
G - Extended from the prior base after wedging higher with recent gains lacking great volume-conviction. Its 50 DMA line ($195) defines near-term support to watch.
>>> FEATURED STOCK ARTICLE : Zebra Extended From Prior Base - 3/25/2019 |
View all notes |
Set NEW NOTE alert |
Company Profile |
SEC
News |
Chart |
Request a new note
C
A
S
I |
SPSC
-
NASDAQ
S P S Commerce Inc
COMPUTER SOFTWARE and SERVICES - Application Software
|
$105.05
|
-0.01
-0.01% |
$106.11
|
160,074
103.94% of 50 DAV
50 DAV is 154,000
|
$113.31
-7.29%
|
3/26/2019
|
$107.12
|
PP = $113.41
|
|
MB = $119.08
|
Most Recent Note - 4/2/2019 5:55:18 PM
Y - Still consolidating in an orderly fashion well above prior highs in the $100 area defining support to watch along with its 50 DMA line ($101.34). Subsequent gains above the pivot point backed by at least +40% above average volume may trigger a new (or add-on) technical buy signal.
>>> FEATURED STOCK ARTICLE : Consolidating in Orderly Fashion Above Prior Highs - 3/22/2019 |
View all notes |
Set NEW NOTE alert |
Company Profile |
SEC
News |
Chart |
Request a new note
C
A
S
I |
SSNC
-
NASDAQ
S S & C Technologies
COMPUTER SOFTWARE and SERVICES - Application Software
|
$64.40
|
-0.34
-0.53% |
$65.17
|
1,819,658
101.88% of 50 DAV
50 DAV is 1,786,000
|
$65.19
-1.21%
|
2/15/2019
|
$59.73
|
PP = $61.07
|
|
MB = $64.12
|
Most Recent Note - 3/28/2019 5:45:20 PM
Y - Still hovering above its pivot point and below its "max buy" level, remaining perched near its all-time high with volume totals cooling in recent weeks. Its 50 DMA line ($57.05) and prior low define near term support to watch. See the latest FSU analysis for more details and an annotated graph.
>>> FEATURED STOCK ARTICLE : Hovering Near High With Volume Totals Cooling in Recent Weeks - 3/27/2019 |
View all notes |
Set NEW NOTE alert |
Company Profile |
SEC
News |
Chart |
Request a new note
C
A
S
I |
Symbol/Exchange
Company Name
Industry Group |
PRICE |
CHANGE
(%Change) |
Day High |
Volume
(% DAV)
(% 50 day avg vol) |
52 Wk Hi
% From Hi |
Featured
Date |
Price
Featured |
Pivot Featured |
|
Max Buy |
IRBT
-
NASDAQ
Irobot Corp
CONSUMER DURABLES - Electronic Equipment
|
$122.63
|
+1.15
0.95% |
$123.92
|
412,078
46.93% of 50 DAV
50 DAV is 878,000
|
$132.88
-7.71%
|
2/8/2019
|
$104.92
|
PP = $103.63
|
|
MB = $108.81
|
Most Recent Note - 4/2/2019 6:04:36 PM
G - Tallied 4 consecutive gains with lighter than average volume. Found prompt support near its August '18 high on the pullback. Its 50 DMA line ($112.55) defines important near-term support while possibly building a new base.
>>> FEATURED STOCK ARTICLE : Consolidating After Getting Extended from Double Bottom Base - 3/12/2019 |
View all notes |
Set NEW NOTE alert |
Company Profile |
SEC
News |
Chart |
Request a new note
C
A
S
I |
AUDC
-
NASDAQ
Audiocodes Ltd
ELECTRONICS - Scientific and Technical Instrum
|
$15.55
|
-0.14
-0.89% |
$16.36
|
433,907
167.53% of 50 DAV
50 DAV is 259,000
|
$15.72
-1.08%
|
3/20/2019
|
$13.66
|
PP = $15.06
|
|
MB = $15.81
|
Most Recent Note - 4/3/2019 12:16:00 PM
Y - Hitting a new 52-week high and today's early gain has it near +5% above its pivot point. Big gain on the prior session backed by +166% above average volume triggered a technical buy signal. Prior lows in the $12.50 area define important near-term support below its 50 DMA line.
>>> FEATURED STOCK ARTICLE : Building a Base and Found Support Near 50-Day Moving Average - 3/20/2019 |
View all notes |
Set NEW NOTE alert |
Company Profile |
SEC
News |
Chart |
Request a new note
C
A
S
I |
ENV
-
NYSE
Envestnet Inc
FINANCIAL SERVICES - Diversified Investments
|
$66.40
|
-0.32
-0.48% |
$67.45
|
264,499
96.89% of 50 DAV
50 DAV is 273,000
|
$67.52
-1.66%
|
3/15/2019
|
$66.05
|
PP = $64.90
|
|
MB = $68.15
|
Most Recent Note - 3/27/2019 6:01:16 PM
Y - Volume totals have been light while consolidating near prior highs. Stalled after its technical breakout was noted on 3/15/19. More damaging losses would raise greater concerns.
>>> FEATURED STOCK ARTICLE : Volume Heavy Behind Rally to New Highs - 3/15/2019 |
View all notes |
Set NEW NOTE alert |
Company Profile |
SEC
News |
Chart |
Request a new note
C
A
S
I |
LHCG
-
NASDAQ
L H C Group Inc
HEALTH SERVICES - Home Health Care
|
$108.92
|
+0.51
0.47% |
$109.59
|
155,925
63.13% of 50 DAV
50 DAV is 247,000
|
$115.54
-5.73%
|
1/23/2019
|
$107.29
|
PP = $107.61
|
|
MB = $112.99
|
Most Recent Note - 4/1/2019 5:17:24 PM
Y - Consolidating near its 50 DMA line ($109). Prior lows define the next important near-term support above its 200 DMA line. See the latest FSU analysis for more details and a new annotated graph.
>>> FEATURED STOCK ARTICLE : Sputtering Near 50-Day Moving Average Line - 4/1/2019 |
View all notes |
Set NEW NOTE alert |
Company Profile |
SEC
News |
Chart |
Request a new note
C
A
S
I |
ENSG
-
NASDAQ
Ensign Group Inc
HEALTH SERVICES - Long-Term Care Facilities
|
$50.61
|
-0.15
-0.30% |
$51.70
|
174,280
54.81% of 50 DAV
50 DAV is 318,000
|
$54.56
-7.24%
|
2/7/2019
|
$48.71
|
PP = $49.06
|
|
MB = $51.51
|
Most Recent Note - 4/1/2019 2:13:54 PM
Y - Still consolidating above prior highs in the $48 area and above its 50 DMA line ($48.32) defining the important near-term support.
>>> FEATURED STOCK ARTICLE : Consolidating Near Proir High and Above 50-Day Average - 3/11/2019 |
View all notes |
Set NEW NOTE alert |
Company Profile |
SEC
News |
Chart |
Request a new note
C
A
S
I |
Symbol/Exchange
Company Name
Industry Group |
PRICE |
CHANGE
(%Change) |
Day High |
Volume
(% DAV)
(% 50 day avg vol) |
52 Wk Hi
% From Hi |
Featured
Date |
Price
Featured |
Pivot Featured |
|
Max Buy |
LULU
-
NASDAQ
Lululemon Athletica
MANUFACTURING - Textile Manufacturing
|
$166.21
|
+0.74
0.45% |
$167.50
|
1,826,358
81.32% of 50 DAV
50 DAV is 2,246,000
|
$171.45
-3.06%
|
3/28/2019
|
$169.20
|
PP = $164.89
|
|
MB = $173.13
|
Most Recent Note - 4/1/2019 1:25:31 PM
Y - Consolidating after a "breakaway gap" on 3/28/19 triggered a technical buy signal. Bullish action came after it reported Jan '19 earnings +39% on +26% sales revenues, marking its 5th consecutive quarterly comparison above the +25% minimum guideline (C criteria). See the latest FSU analysis for more details and an annotated graph.
>>> FEATURED STOCK ARTICLE : Breakway Gap Backed by More Than 6 Times Average Volume - 3/28/2019 |
View all notes |
Set NEW NOTE alert |
Company Profile |
SEC
News |
Chart |
Request a new note
C
A
S
I |
NXST
-
NASDAQ
Nexstar Media Group Cl A
MEDIA - Broadcasting - TV
|
$110.27
|
+1.60
1.47% |
$110.50
|
461,196
87.02% of 50 DAV
50 DAV is 530,000
|
$111.34
-0.96%
|
2/26/2019
|
$94.26
|
PP = $89.76
|
|
MB = $94.25
|
Most Recent Note - 3/27/2019 6:03:29 PM
G - Posted a solid gain today with near average volume hitting another new all-time high. Disciplined investors avoid chasing stocks more than +5% above the prior high.
>>> FEATURED STOCK ARTICLE : Twice Average Volume Behind Gain for New High - 2/26/2019 |
View all notes |
Set NEW NOTE alert |
Company Profile |
SEC
News |
Chart |
Request a new note
C
A
S
I |
ULTA
-
NASDAQ
Ulta Beauty Inc
SPECIALTY RETAIL - Specialty Retail, Other
|
$350.53
|
+3.23
0.93% |
$354.44
|
506,382
64.34% of 50 DAV
50 DAV is 787,000
|
$354.09
-1.01%
|
3/15/2019
|
$341.27
|
PP = $322.59
|
|
MB = $338.72
|
Most Recent Note - 3/29/2019 6:55:55 PM
Y - Posted a gain today on light volume for a best ever close. A big "breakaway gap" on 3/15/19 backed by heavy volume triggered a technical buy signal. Bullish action came after it reported earnings +31% sales revenues on +10% sales revenues for the Jan '19 quarter.
>>> FEATURED STOCK ARTICLE : Consolidating Following Big "Breakaway Gap" - 3/19/2019 |
View all notes |
Set NEW NOTE alert |
Company Profile |
SEC
News |
Chart |
Request a new note
C
A
S
I |
UBNT
-
NASDAQ
Ubiquiti Networks
TELECOMMUNICATIONS - Diversified Communication Serv
|
$160.67
|
+2.53
1.60% |
$162.73
|
599,633
161.63% of 50 DAV
50 DAV is 371,000
|
$158.96
1.08%
|
2/8/2019
|
$121.97
|
PP = $115.54
|
|
MB = $121.32
|
Most Recent Note - 4/2/2019 6:09:25 PM
G - Hit yet another new all-time high with today's 4th consecutive volume-driven gain. It did not form a sound base of sufficient length but held its ground stubbornly after a big rally. Its prior low ($136.08 on 3/08/19) and 50 DMA line ($133.51) define near-term support to watch. Fundamentals remain strong.
>>> FEATURED STOCK ARTICLE : Bullish Action Came Following Another Strong Earnings Report - 3/5/2019 |
View all notes |
Set NEW NOTE alert |
Company Profile |
SEC
News |
Chart |
Request a new note
C
A
S
I |
ESNT
-
NYSE
Essent Group Ltd
Finance-MrtgandRel Svc
|
$45.27
|
+0.18
0.40% |
$45.80
|
300,960
48.54% of 50 DAV
50 DAV is 620,000
|
$47.94
-5.57%
|
3/18/2019
|
$45.84
|
PP = $45.06
|
|
MB = $47.31
|
Most Recent Note - 4/1/2019 2:16:38 PM
Y - Found support above its 50 DMA line defining important near-term support in the $42 area. Raised concerns when weakness negated the recent breakout and it was repeatedly noted - "Faces some resistance due to overhead supply up to the $50 level."
>>> FEATURED STOCK ARTICLE : Big Breakout Gain With +350% Above Average Volume - 3/18/2019 |
View all notes |
Set NEW NOTE alert |
Company Profile |
SEC
News |
Chart |
Request a new note
C
A
S
I |
Symbol/Exchange
Company Name
Industry Group |
PRICE |
CHANGE
(%Change) |
Day High |
Volume
(% DAV)
(% 50 day avg vol) |
52 Wk Hi
% From Hi |
Featured
Date |
Price
Featured |
Pivot Featured |
|
Max Buy |
NOW
-
NYSE
Servicenow Inc
Computer Sftwr-Enterprse
|
$247.14
|
+0.32
0.13% |
$248.90
|
1,046,561
50.66% of 50 DAV
50 DAV is 2,066,000
|
$251.65
-1.79%
|
1/31/2019
|
$218.14
|
PP = $206.40
|
|
MB = $216.72
|
Most Recent Note - 4/2/2019 5:56:08 PM
G - Stubbornly holding its ground perched near its all-time high, extended from any sound base. Its 50 DMA line ($229) and recent low ($226) define near-term support to watch on pullbacks.
>>> FEATURED STOCK ARTICLE : Pulling Back After 6 Straight Weekly Gains - 3/6/2019 |
View all notes |
Set NEW NOTE alert |
Company Profile |
SEC
News |
Chart |
Request a new note
C
A
S
I |
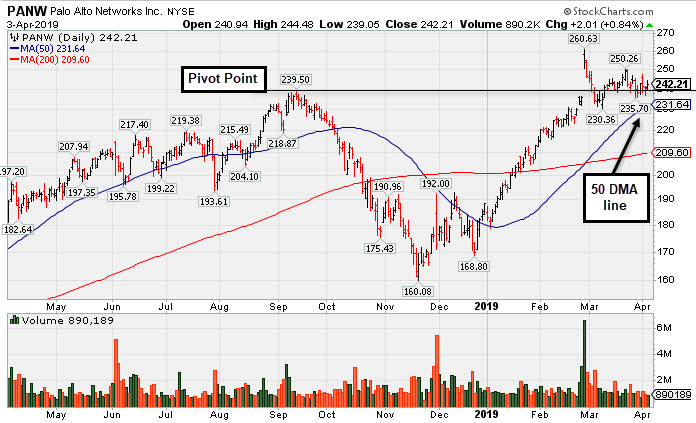
PANW
-
NYSE
Palo Alto Networks
Computer Sftwr-Security
|
$242.21
|
+2.01
0.84% |
$244.48
|
897,989
62.40% of 50 DAV
50 DAV is 1,439,000
|
$260.63
-7.07%
|
2/25/2019
|
$233.54
|
PP = $239.60
|
|
MB = $251.58
|
Most Recent Note - 4/3/2019 5:33:10 PM
Y - Volume totals have been cooling while still consolidating above its prior low and above its 50 DMA line defining important support to watch in the $230 area. Fundamentals remain strong. See the latest FSU analysis for more details and a new annotated graph.
>>> FEATURED STOCK ARTICLE : Consolidating Above Prior High and 50-Day Average - 4/3/2019 |
View all notes |
Set NEW NOTE alert |
Company Profile |
SEC
News |
Chart |
Request a new note
C
A
S
I |
ANET
-
NYSE
Arista Networks Inc
TELECOMMUNICATIONS - Communication Equipment
|
$321.75
|
+3.32
1.04% |
$325.00
|
770,542
85.81% of 50 DAV
50 DAV is 898,000
|
$320.88
0.27%
|
3/13/2019
|
$295.38
|
PP = $313.37
|
|
MB = $329.04
|
Most Recent Note - 4/2/2019 6:02:10 PM
Y - Inched into new high territory with lighter than average volume behind today's 7th consecutive gain. It rebounded above its pivot point but remains below the "max buy" level previously noted.
>>> FEATURED STOCK ARTICLE : Rebounding Near High After Deep Consolidation - 3/13/2019 |
View all notes |
Set NEW NOTE alert |
Company Profile |
SEC
News |
Chart |
Request a new note
C
A
S
I |
PAYC
-
NYSE
Paycom Software Inc
COMPUTER SOFTWARE and SERVICES - Application Software
|
$190.31
|
-0.41
-0.21% |
$192.89
|
550,290
81.04% of 50 DAV
50 DAV is 679,000
|
$193.75
-1.78%
|
2/6/2019
|
$171.66
|
PP = $164.18
|
|
MB = $172.39
|
Most Recent Note - 3/29/2019 6:53:01 PM
G - Posted a gain today with above average volume for its second best ever close. It did not form a sound new base of sufficient length but stubbornly held its ground. Its 50 DMA line and prior low coincide defining important near-term support to watch in the $169-170 area.
>>> FEATURED STOCK ARTICLE : Consolidating Near All-Time High - 3/8/2019 |
View all notes |
Set NEW NOTE alert |
Company Profile |
SEC
News |
Chart |
Request a new note
C
A
S
I |
PYPL
-
NASDAQ
Paypal Holdings Inc
Finance-CrdtCard/PmtPr
|
$104.69
|
-0.54
-0.51% |
$105.97
|
5,435,862
76.35% of 50 DAV
50 DAV is 7,120,000
|
$105.76
-1.01%
|
1/24/2019
|
$92.56
|
PP = $93.80
|
|
MB = $98.49
|
Most Recent Note - 4/2/2019 5:53:35 PM
G - Quietly perched at its all-time high, extended from any sound base after gains with lighter than average volume in recent weeks. Its 50 DMA line ($96.62) and prior highs in the $94 area define important near-term support to watch on pullbacks. See the latest FSU analysis for more details and a new annotated graph.
>>> FEATURED STOCK ARTICLE : Extended From Base After Gains in Recent Weeks Lacking Volume - 4/2/2019 |
View all notes |
Set NEW NOTE alert |
Company Profile |
SEC
News |
Chart |
Request a new note
C
A
S
I |
Symbol/Exchange
Company Name
Industry Group |
PRICE |
CHANGE
(%Change) |
Day High |
Volume
(% DAV)
(% 50 day avg vol) |
52 Wk Hi
% From Hi |
Featured
Date |
Price
Featured |
Pivot Featured |
|
Max Buy |
ALRM
-
NASDAQ
Alarm.com Holdings Inc
Security/Sfty
|
$65.59
|
+0.44
0.68% |
$66.17
|
499,197
98.85% of 50 DAV
50 DAV is 505,000
|
$66.44
-1.27%
|
1/22/2019
|
$60.52
|
PP = $60.30
|
|
MB = $63.32
|
Most Recent Note - 3/29/2019 6:46:40 PM
G - Found support near its 50 DMA line ($62.18). Weak action came after it recently reported earnings +12% on +25% sales revenues for the Dec '18 quarter, below the +25% minimum earnings guideline (C criteria), raising fundamental concerns. See the latest FSU analysis for more details and a new annotated graph.
>>> FEATURED STOCK ARTICLE : Consolidating Near 50-Day Average Following Sub Par Report - 3/29/2019 |
View all notes |
Set NEW NOTE alert |
Company Profile |
SEC
News |
Chart |
Request a new note
C
A
S
I |
PLNT
-
NYSE
Planet Fitness Inc Cl A
Leisure-Services
|
$71.25
|
+0.67
0.95% |
$71.36
|
2,000,717
144.98% of 50 DAV
50 DAV is 1,380,000
|
$70.77
0.68%
|
11/7/2018
|
$57.10
|
PP = $55.45
|
|
MB = $58.22
|
Most Recent Note - 4/2/2019 5:58:52 PM
G - Hit another new all-time high with today's 5th consecutive gain, getting more extended from any sound base. Its 50 DMA line (61.90) and prior highs define near-term support in the $59-60 area. Fundamentals remain strong.
>>> FEATURED STOCK ARTICLE : Met Distributional Pressure While Hitting New High After Earnings - 2/27/2019 |
View all notes |
Set NEW NOTE alert |
Company Profile |
SEC
News |
Chart |
Request a new note
C
A
S
I |
TEAM
-
NASDAQ
Atlassian Corp Plc Cl A
Comp Sftwr-Spec Enterprs
|
$115.36
|
-0.24
-0.21% |
$116.70
|
1,102,305
74.94% of 50 DAV
50 DAV is 1,471,000
|
$116.09
-0.63%
|
1/7/2019
|
$94.68
|
PP = $98.31
|
|
MB = $103.23
|
Most Recent Note - 3/27/2019 6:14:29 PM
G - Enduring distributional pressure and it is extended from any sound base. Its 50 DMA line ($103.67) and recent low ($99.77 on 3/04/19) define near-term support to watch. Fundamentals remain strong.
>>> FEATURED STOCK ARTICLE : Pullback on Higher Volume After Recent Gains With Less Volume - 3/4/2019 |
View all notes |
Set NEW NOTE alert |
Company Profile |
SEC
News |
Chart |
Request a new note
C
A
S
I |
GLOB
-
NYSE
Globant SA
Computer-Tech Services
|
$74.51
|
+1.87
2.57% |
$75.23
|
239,067
119.53% of 50 DAV
50 DAV is 200,000
|
$74.00
0.69%
|
2/15/2019
|
$69.35
|
PP = $70.00
|
|
MB = $73.50
|
Most Recent Note - 4/3/2019 5:37:00 PM
G - Hit a new all-time high and rose above its "max buy" level with today's 2nd consecutive big gain with slightly above average volume and its color code is changed to green. Found prompt support at its 50 DMA line ($69.59) and above prior lows in the $66-67 area. Violations would raise concerns and trigger technical sell signals.
>>> FEATURED STOCK ARTICLE : Consolidating Near 50-Day Average Quietly Perched Near High - 3/26/2019 |
View all notes |
Set NEW NOTE alert |
Company Profile |
SEC
News |
Chart |
Request a new note
C
A
S
I |
TTD
-
NASDAQ
The Trade Desk Inc Cl A
Comml Svcs-Advertising
|
$207.21
|
+0.37
0.18% |
$209.69
|
1,348,987
84.74% of 50 DAV
50 DAV is 1,592,000
|
$214.70
-3.49%
|
2/6/2019
|
$148.65
|
PP = $149.00
|
|
MB = $156.45
|
Most Recent Note - 4/1/2019 1:36:45 PM
G - Very extended from the prior base, recently enduring distributional pressure. Its 50 DMA line ($173.88) defines initial support to watch above the prior high ($161).
>>> FEATURED STOCK ARTICLE : Hit Another New All-Time High Getting Extended From Prior Base - 3/21/2019 |
View all notes |
Set NEW NOTE alert |
Company Profile |
SEC
News |
Chart |
Request a new note
C
A
S
I |
Symbol/Exchange
Company Name
Industry Group |
PRICE |
CHANGE
(%Change) |
Day High |
Volume
(% DAV)
(% 50 day avg vol) |
52 Wk Hi
% From Hi |
Featured
Date |
Price
Featured |
Pivot Featured |
|
Max Buy |