***Last / Change / Volume data in this table is the closing quote data***
Symbol/Exchange
Company Name
Industry Group |
PRICE |
CHANGE
(%Change) |
Day High |
Volume
(% DAV)
(% 50 day avg vol) |
52 Wk Hi
% From Hi |
Featured
Date |
Price
Featured |
Pivot Featured |
|
Max Buy |
MLR
-
NYSE
Miller Industries Inc
AUTOMOTIVE - Auto Parts
|
$31.00
|
-0.12
-0.39% |
$31.35
|
35,115
94.91% of 50 DAV
50 DAV is 37,000
|
$35.26
-12.08%
|
11/30/2018
|
$28.35
|
PP = $29.50
|
|
MB = $30.98
|
Most Recent Note - 3/28/2019 1:03:31 PM
G - Sputtering below its 50 DMA line ($31.62) for a week. A rebound above the 50 DMA line is needed for its outlook to improve. Prior highs in the $29 area define the next near-term support to watch. Reported earnings +17% on +13% sales revenues for the Dec '18 quarter, below the +25% minimum guideline (C criteria), raising fundamental concerns, and it has endured mild distributional pressure in recent weeks.
>>> FEATURED STOCK ARTICLE : Extended From Prior Base After Impressive Streak of Gains - 3/1/2019 |
View all notes |
Set NEW NOTE alert |
Company Profile |
SEC
News |
Chart |
Request a new note
C
A
S
I |
NSP
-
NYSE
Insperity Inc
Comml Svcs-Outsourcing
|
$126.28
|
+0.35
0.28% |
$126.64
|
323,915
88.50% of 50 DAV
50 DAV is 366,000
|
$132.50
-4.69%
|
2/11/2019
|
$127.91
|
PP = $121.25
|
|
MB = $127.31
|
Most Recent Note - 3/29/2019 6:54:37 PM
Y - Consolidating above its 50 DMA line ($118.66) and near prior highs in the $119-121 area which define important near-term support to watch.
>>> FEATURED STOCK ARTICLE : Volume Totals Cooling and Consolidating Near Prior Highs - 3/14/2019 |
View all notes |
Set NEW NOTE alert |
Company Profile |
SEC
News |
Chart |
Request a new note
C
A
S
I |
ZBRA
-
NASDAQ
Zebra Tech Corp Cl A
COMPUTER HARDWARE - Computer Peripherals
|
$213.62
|
+1.71
0.81% |
$214.70
|
338,557
74.41% of 50 DAV
50 DAV is 455,000
|
$219.39
-2.63%
|
2/14/2019
|
$198.10
|
PP = $184.85
|
|
MB = $194.09
|
Most Recent Note - 4/1/2019 2:18:08 PM
G - Extended from the prior base after wedging higher with recent gains lacking great volume-conviction. Its 50 DMA line ($195) defines near-term support to watch.
>>> FEATURED STOCK ARTICLE : Zebra Extended From Prior Base - 3/25/2019 |
View all notes |
Set NEW NOTE alert |
Company Profile |
SEC
News |
Chart |
Request a new note
C
A
S
I |
SPSC
-
NASDAQ
S P S Commerce Inc
COMPUTER SOFTWARE and SERVICES - Application Software
|
$105.06
|
-0.51
-0.48% |
$106.51
|
142,674
92.65% of 50 DAV
50 DAV is 154,000
|
$113.31
-7.28%
|
3/26/2019
|
$107.12
|
PP = $113.41
|
|
MB = $119.08
|
 Most Recent Note - 4/2/2019 5:55:18 PM
Y - Still consolidating in an orderly fashion well above prior highs in the $100 area defining support to watch along with its 50 DMA line ($101.34). Subsequent gains above the pivot point backed by at least +40% above average volume may trigger a new (or add-on) technical buy signal.
>>> FEATURED STOCK ARTICLE : Consolidating in Orderly Fashion Above Prior Highs - 3/22/2019 |
View all notes |
Set NEW NOTE alert |
Company Profile |
SEC
News |
Chart |
Request a new note
C
A
S
I |
SSNC
-
NASDAQ
S S & C Technologies
COMPUTER SOFTWARE and SERVICES - Application Software
|
$64.74
|
+0.37
0.57% |
$65.00
|
1,008,834
55.98% of 50 DAV
50 DAV is 1,802,000
|
$65.19
-0.69%
|
2/15/2019
|
$59.73
|
PP = $61.07
|
|
MB = $64.12
|
Most Recent Note - 3/28/2019 5:45:20 PM
Y - Still hovering above its pivot point and below its "max buy" level, remaining perched near its all-time high with volume totals cooling in recent weeks. Its 50 DMA line ($57.05) and prior low define near term support to watch. See the latest FSU analysis for more details and an annotated graph.
>>> FEATURED STOCK ARTICLE : Hovering Near High With Volume Totals Cooling in Recent Weeks - 3/27/2019 |
View all notes |
Set NEW NOTE alert |
Company Profile |
SEC
News |
Chart |
Request a new note
C
A
S
I |
Symbol/Exchange
Company Name
Industry Group |
PRICE |
CHANGE
(%Change) |
Day High |
Volume
(% DAV)
(% 50 day avg vol) |
52 Wk Hi
% From Hi |
Featured
Date |
Price
Featured |
Pivot Featured |
|
Max Buy |
IRBT
-
NASDAQ
Irobot Corp
CONSUMER DURABLES - Electronic Equipment
|
$121.48
|
+2.54
2.14% |
$122.50
|
373,878
42.15% of 50 DAV
50 DAV is 887,000
|
$132.88
-8.58%
|
2/8/2019
|
$104.92
|
PP = $103.63
|
|
MB = $108.81
|
Most Recent Note - 4/2/2019 6:04:36 PM
G - Tallied 4 consecutive gains with lighter than average volume. Found prompt support near its August '18 high on the pullback. Its 50 DMA line ($112.55) defines important near-term support while possibly building a new base.
>>> FEATURED STOCK ARTICLE : Consolidating After Getting Extended from Double Bottom Base - 3/12/2019 |
View all notes |
Set NEW NOTE alert |
Company Profile |
SEC
News |
Chart |
Request a new note
C
A
S
I |
AUDC
-
NASDAQ
Audiocodes Ltd
ELECTRONICS - Scientific and Technical Instrum
|
$15.69
|
+1.44
10.11% |
$15.72
|
688,128
278.59% of 50 DAV
50 DAV is 247,000
|
$14.96
4.88%
|
3/20/2019
|
$13.66
|
PP = $15.06
|
|
MB = $15.81
|
Most Recent Note - 4/2/2019 12:25:00 PM
Y - Challenging its 52-week high with today's volume-driven gain. Subsequent gains above the pivot point backed by at least +40% above average volume are needed to trigger a new technical buy signal. Prior lows in the $12.50 area define important near-term support below its 50 DMA line.
>>> FEATURED STOCK ARTICLE : Building a Base and Found Support Near 50-Day Moving Average - 3/20/2019 |
View all notes |
Set NEW NOTE alert |
Company Profile |
SEC
News |
Chart |
Request a new note
C
A
S
I |
ENV
-
NYSE
Envestnet Inc
FINANCIAL SERVICES - Diversified Investments
|
$66.72
|
+0.19
0.29% |
$66.88
|
143,439
51.97% of 50 DAV
50 DAV is 276,000
|
$67.52
-1.18%
|
3/15/2019
|
$66.05
|
PP = $64.90
|
|
MB = $68.15
|
Most Recent Note - 3/27/2019 6:01:16 PM
Y - Volume totals have been light while consolidating near prior highs. Stalled after its technical breakout was noted on 3/15/19. More damaging losses would raise greater concerns.
>>> FEATURED STOCK ARTICLE : Volume Heavy Behind Rally to New Highs - 3/15/2019 |
View all notes |
Set NEW NOTE alert |
Company Profile |
SEC
News |
Chart |
Request a new note
C
A
S
I |
LHCG
-
NASDAQ
L H C Group Inc
HEALTH SERVICES - Home Health Care
|
$108.41
|
-0.02
-0.02% |
$108.57
|
160,772
64.31% of 50 DAV
50 DAV is 250,000
|
$115.54
-6.17%
|
1/23/2019
|
$107.29
|
PP = $107.61
|
|
MB = $112.99
|
Most Recent Note - 4/1/2019 5:17:24 PM
Y - Consolidating near its 50 DMA line ($109). Prior lows define the next important near-term support above its 200 DMA line. See the latest FSU analysis for more details and a new annotated graph.
>>> FEATURED STOCK ARTICLE : Sputtering Near 50-Day Moving Average Line - 4/1/2019 |
View all notes |
Set NEW NOTE alert |
Company Profile |
SEC
News |
Chart |
Request a new note
C
A
S
I |
ENSG
-
NASDAQ
Ensign Group Inc
HEALTH SERVICES - Long-Term Care Facilities
|
$50.76
|
-0.16
-0.31% |
$51.29
|
245,949
76.86% of 50 DAV
50 DAV is 320,000
|
$54.56
-6.96%
|
2/7/2019
|
$48.71
|
PP = $49.06
|
|
MB = $51.51
|
Most Recent Note - 4/1/2019 2:13:54 PM
Y - Still consolidating above prior highs in the $48 area and above its 50 DMA line ($48.32) defining the important near-term support.
>>> FEATURED STOCK ARTICLE : Consolidating Near Proir High and Above 50-Day Average - 3/11/2019 |
View all notes |
Set NEW NOTE alert |
Company Profile |
SEC
News |
Chart |
Request a new note
C
A
S
I |
Symbol/Exchange
Company Name
Industry Group |
PRICE |
CHANGE
(%Change) |
Day High |
Volume
(% DAV)
(% 50 day avg vol) |
52 Wk Hi
% From Hi |
Featured
Date |
Price
Featured |
Pivot Featured |
|
Max Buy |
LULU
-
NASDAQ
Lululemon Athletica
MANUFACTURING - Textile Manufacturing
|
$165.47
|
-0.05
-0.03% |
$166.70
|
2,145,908
94.66% of 50 DAV
50 DAV is 2,267,000
|
$171.45
-3.49%
|
3/28/2019
|
$169.20
|
PP = $164.89
|
|
MB = $173.13
|
Most Recent Note - 4/1/2019 1:25:31 PM
Y - Consolidating after a "breakaway gap" on 3/28/19 triggered a technical buy signal. Bullish action came after it reported Jan '19 earnings +39% on +26% sales revenues, marking its 5th consecutive quarterly comparison above the +25% minimum guideline (C criteria). See the latest FSU analysis for more details and an annotated graph.
>>> FEATURED STOCK ARTICLE : Breakway Gap Backed by More Than 6 Times Average Volume - 3/28/2019 |
View all notes |
Set NEW NOTE alert |
Company Profile |
SEC
News |
Chart |
Request a new note
C
A
S
I |
NXST
-
NASDAQ
Nexstar Media Group Cl A
MEDIA - Broadcasting - TV
|
$108.67
|
-0.50
-0.46% |
$109.65
|
410,693
77.64% of 50 DAV
50 DAV is 529,000
|
$111.34
-2.40%
|
2/26/2019
|
$94.26
|
PP = $89.76
|
|
MB = $94.25
|
Most Recent Note - 3/27/2019 6:03:29 PM
G - Posted a solid gain today with near average volume hitting another new all-time high. Disciplined investors avoid chasing stocks more than +5% above the prior high.
>>> FEATURED STOCK ARTICLE : Twice Average Volume Behind Gain for New High - 2/26/2019 |
View all notes |
Set NEW NOTE alert |
Company Profile |
SEC
News |
Chart |
Request a new note
C
A
S
I |
ULTA
-
NASDAQ
Ulta Beauty Inc
SPECIALTY RETAIL - Specialty Retail, Other
|
$347.30
|
-5.25
-1.49% |
$354.09
|
495,482
62.25% of 50 DAV
50 DAV is 796,000
|
$353.78
-1.83%
|
3/15/2019
|
$341.27
|
PP = $322.59
|
|
MB = $338.72
|
Most Recent Note - 3/29/2019 6:55:55 PM
Y - Posted a gain today on light volume for a best ever close. A big "breakaway gap" on 3/15/19 backed by heavy volume triggered a technical buy signal. Bullish action came after it reported earnings +31% sales revenues on +10% sales revenues for the Jan '19 quarter.
>>> FEATURED STOCK ARTICLE : Consolidating Following Big "Breakaway Gap" - 3/19/2019 |
View all notes |
Set NEW NOTE alert |
Company Profile |
SEC
News |
Chart |
Request a new note
C
A
S
I |
UBNT
-
NASDAQ
Ubiquiti Networks
TELECOMMUNICATIONS - Diversified Communication Serv
|
$158.14
|
+3.51
2.27% |
$158.96
|
491,699
133.98% of 50 DAV
50 DAV is 367,000
|
$155.13
1.94%
|
2/8/2019
|
$121.97
|
PP = $115.54
|
|
MB = $121.32
|
Most Recent Note - 4/2/2019 6:09:25 PM
G - Hit yet another new all-time high with today's 4th consecutive volume-driven gain. It did not form a sound base of sufficient length but held its ground stubbornly after a big rally. Its prior low ($136.08 on 3/08/19) and 50 DMA line ($133.51) define near-term support to watch. Fundamentals remain strong.
>>> FEATURED STOCK ARTICLE : Bullish Action Came Following Another Strong Earnings Report - 3/5/2019 |
View all notes |
Set NEW NOTE alert |
Company Profile |
SEC
News |
Chart |
Request a new note
C
A
S
I |
ESNT
-
NYSE
Essent Group Ltd
Finance-MrtgandRel Svc
|
$45.09
|
+0.12
0.27% |
$45.31
|
341,154
54.85% of 50 DAV
50 DAV is 622,000
|
$47.94
-5.94%
|
3/18/2019
|
$45.84
|
PP = $45.06
|
|
MB = $47.31
|
Most Recent Note - 4/1/2019 2:16:38 PM
Y - Found support above its 50 DMA line defining important near-term support in the $42 area. Raised concerns when weakness negated the recent breakout and it was repeatedly noted - "Faces some resistance due to overhead supply up to the $50 level."
>>> FEATURED STOCK ARTICLE : Big Breakout Gain With +350% Above Average Volume - 3/18/2019 |
View all notes |
Set NEW NOTE alert |
Company Profile |
SEC
News |
Chart |
Request a new note
C
A
S
I |
Symbol/Exchange
Company Name
Industry Group |
PRICE |
CHANGE
(%Change) |
Day High |
Volume
(% DAV)
(% 50 day avg vol) |
52 Wk Hi
% From Hi |
Featured
Date |
Price
Featured |
Pivot Featured |
|
Max Buy |
NOW
-
NYSE
Servicenow Inc
Computer Sftwr-Enterprse
|
$246.82
|
+1.09
0.44% |
$247.02
|
1,469,336
70.81% of 50 DAV
50 DAV is 2,075,000
|
$251.65
-1.92%
|
1/31/2019
|
$218.14
|
PP = $206.40
|
|
MB = $216.72
|
Most Recent Note - 4/2/2019 5:56:08 PM
G - Stubbornly holding its ground perched near its all-time high, extended from any sound base. Its 50 DMA line ($229) and recent low ($226) define near-term support to watch on pullbacks.
>>> FEATURED STOCK ARTICLE : Pulling Back After 6 Straight Weekly Gains - 3/6/2019 |
View all notes |
Set NEW NOTE alert |
Company Profile |
SEC
News |
Chart |
Request a new note
C
A
S
I |
PANW
-
NYSE
Palo Alto Networks
Computer Sftwr-Security
|
$240.20
|
-1.21
-0.50% |
$241.41
|
935,977
64.59% of 50 DAV
50 DAV is 1,449,000
|
$260.63
-7.84%
|
2/25/2019
|
$233.54
|
PP = $239.60
|
|
MB = $251.58
|
Most Recent Note - 3/29/2019 6:51:02 PM
Y - Volume totals have been cooling while consolidating above its prior low and above its 50 DMA line defining important support to watch in the $230 area. Fundamentals remain strong.
>>> FEATURED STOCK ARTICLE : Rebounded Near Prior High With Earnings News Due - 2/25/2019 |
View all notes |
Set NEW NOTE alert |
Company Profile |
SEC
News |
Chart |
Request a new note
C
A
S
I |
ANET
-
NYSE
Arista Networks Inc
TELECOMMUNICATIONS - Communication Equipment
|
$318.43
|
+0.07
0.02% |
$320.88
|
642,833
70.33% of 50 DAV
50 DAV is 914,000
|
$319.41
-0.31%
|
3/13/2019
|
$295.38
|
PP = $313.37
|
|
MB = $329.04
|
Most Recent Note - 4/2/2019 6:02:10 PM
Y - Inched into new high territory with lighter than average volume behind today's 7th consecutive gain. It rebounded above its pivot point but remains below the "max buy" level previously noted.
>>> FEATURED STOCK ARTICLE : Rebounding Near High After Deep Consolidation - 3/13/2019 |
View all notes |
Set NEW NOTE alert |
Company Profile |
SEC
News |
Chart |
Request a new note
C
A
S
I |
PAYC
-
NYSE
Paycom Software Inc
COMPUTER SOFTWARE and SERVICES - Application Software
|
$190.72
|
+0.44
0.23% |
$191.45
|
401,975
58.77% of 50 DAV
50 DAV is 684,000
|
$193.75
-1.56%
|
2/6/2019
|
$171.66
|
PP = $164.18
|
|
MB = $172.39
|
Most Recent Note - 3/29/2019 6:53:01 PM
G - Posted a gain today with above average volume for its second best ever close. It did not form a sound new base of sufficient length but stubbornly held its ground. Its 50 DMA line and prior low coincide defining important near-term support to watch in the $169-170 area.
>>> FEATURED STOCK ARTICLE : Consolidating Near All-Time High - 3/8/2019 |
View all notes |
Set NEW NOTE alert |
Company Profile |
SEC
News |
Chart |
Request a new note
C
A
S
I |
PYPL
-
NASDAQ
Paypal Holdings Inc
Finance-CrdtCard/PmtPr
|
$105.23
|
-0.32
-0.30% |
$105.76
|
3,978,830
54.69% of 50 DAV
50 DAV is 7,275,000
|
$105.76
-0.50%
|
1/24/2019
|
$92.56
|
PP = $93.80
|
|
MB = $98.49
|
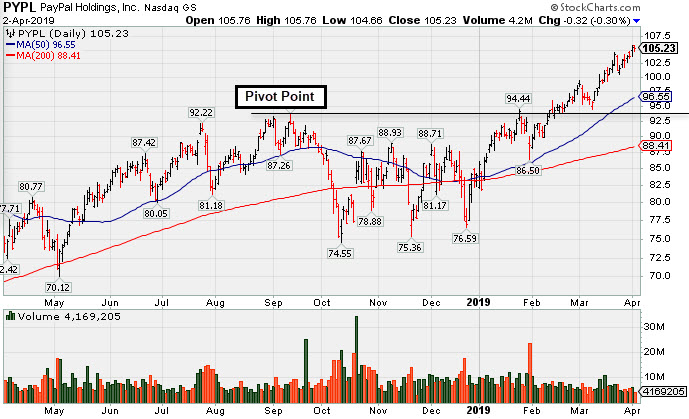
Most Recent Note - 4/2/2019 5:53:35 PM
G - Quietly perched at its all-time high, extended from any sound base after gains with lighter than average volume in recent weeks. Its 50 DMA line ($96.62) and prior highs in the $94 area define important near-term support to watch on pullbacks. See the latest FSU analysis for more details and a new annotated graph.
>>> FEATURED STOCK ARTICLE : Extended From Base After Gains in Recent Weeks Lacking Volume - 4/2/2019 |
View all notes |
Set NEW NOTE alert |
Company Profile |
SEC
News |
Chart |
Request a new note
C
A
S
I |
Symbol/Exchange
Company Name
Industry Group |
PRICE |
CHANGE
(%Change) |
Day High |
Volume
(% DAV)
(% 50 day avg vol) |
52 Wk Hi
% From Hi |
Featured
Date |
Price
Featured |
Pivot Featured |
|
Max Buy |
ALRM
-
NASDAQ
Alarm.com Holdings Inc
Security/Sfty
|
$65.15
|
+0.12
0.18% |
$65.26
|
353,998
67.95% of 50 DAV
50 DAV is 521,000
|
$66.44
-1.93%
|
1/22/2019
|
$60.52
|
PP = $60.30
|
|
MB = $63.32
|
Most Recent Note - 3/29/2019 6:46:40 PM
G - Found support near its 50 DMA line ($62.18). Weak action came after it recently reported earnings +12% on +25% sales revenues for the Dec '18 quarter, below the +25% minimum earnings guideline (C criteria), raising fundamental concerns. See the latest FSU analysis for more details and a new annotated graph.
>>> FEATURED STOCK ARTICLE : Consolidating Near 50-Day Average Following Sub Par Report - 3/29/2019 |
View all notes |
Set NEW NOTE alert |
Company Profile |
SEC
News |
Chart |
Request a new note
C
A
S
I |
PLNT
-
NYSE
Planet Fitness Inc Cl A
Leisure-Services
|
$70.58
|
+0.85
1.22% |
$70.77
|
1,465,080
106.71% of 50 DAV
50 DAV is 1,373,000
|
$69.76
1.18%
|
11/7/2018
|
$57.10
|
PP = $55.45
|
|
MB = $58.22
|
Most Recent Note - 4/2/2019 5:58:52 PM
G - Hit another new all-time high with today's 5th consecutive gain, getting more extended from any sound base. Its 50 DMA line (61.90) and prior highs define near-term support in the $59-60 area. Fundamentals remain strong.
>>> FEATURED STOCK ARTICLE : Met Distributional Pressure While Hitting New High After Earnings - 2/27/2019 |
View all notes |
Set NEW NOTE alert |
Company Profile |
SEC
News |
Chart |
Request a new note
C
A
S
I |
TEAM
-
NASDAQ
Atlassian Corp Plc Cl A
Comp Sftwr-Spec Enterprs
|
$115.60
|
+1.73
1.52% |
$116.09
|
978,692
60.98% of 50 DAV
50 DAV is 1,605,000
|
$115.88
-0.24%
|
1/7/2019
|
$94.68
|
PP = $98.31
|
|
MB = $103.23
|
Most Recent Note - 3/27/2019 6:14:29 PM
G - Enduring distributional pressure and it is extended from any sound base. Its 50 DMA line ($103.67) and recent low ($99.77 on 3/04/19) define near-term support to watch. Fundamentals remain strong.
>>> FEATURED STOCK ARTICLE : Pullback on Higher Volume After Recent Gains With Less Volume - 3/4/2019 |
View all notes |
Set NEW NOTE alert |
Company Profile |
SEC
News |
Chart |
Request a new note
C
A
S
I |
GLOB
-
NYSE
Globant SA
Computer-Tech Services
|
$72.64
|
+2.87
4.11% |
$73.12
|
237,604
116.47% of 50 DAV
50 DAV is 204,000
|
$74.00
-1.84%
|
2/15/2019
|
$69.35
|
PP = $70.00
|
|
MB = $73.50
|
Most Recent Note - 4/2/2019 6:07:21 PM
Y - Challenged its all-time high with a big gain today with slightly above average volume. Found prompt support at its 50 DMA line ($69.38) and above prior lows in the $66-67 area. Violations would raise concerns and trigger technical sell signals.
>>> FEATURED STOCK ARTICLE : Consolidating Near 50-Day Average Quietly Perched Near High - 3/26/2019 |
View all notes |
Set NEW NOTE alert |
Company Profile |
SEC
News |
Chart |
Request a new note
C
A
S
I |
TTD
-
NASDAQ
The Trade Desk Inc Cl A
Comml Svcs-Advertising
|
$206.84
|
+0.71
0.34% |
$207.48
|
1,131,567
71.12% of 50 DAV
50 DAV is 1,591,000
|
$214.70
-3.66%
|
2/6/2019
|
$148.65
|
PP = $149.00
|
|
MB = $156.45
|
Most Recent Note - 4/1/2019 1:36:45 PM
G - Very extended from the prior base, recently enduring distributional pressure. Its 50 DMA line ($173.88) defines initial support to watch above the prior high ($161).
>>> FEATURED STOCK ARTICLE : Hit Another New All-Time High Getting Extended From Prior Base - 3/21/2019 |
View all notes |
Set NEW NOTE alert |
Company Profile |
SEC
News |
Chart |
Request a new note
C
A
S
I |
Symbol/Exchange
Company Name
Industry Group |
PRICE |
CHANGE
(%Change) |
Day High |
Volume
(% DAV)
(% 50 day avg vol) |
52 Wk Hi
% From Hi |
Featured
Date |
Price
Featured |
Pivot Featured |
|
Max Buy |