You are not logged in.
This means you
CAN ONLY VIEW reports that were published prior to Sunday, February 25, 2024.
You
MUST UPGRADE YOUR MEMBERSHIP if you want to see any current reports.
AFTER MARKET UPDATE - THURSDAY, MARCH 31ST, 2022
Previous After Market Report Next After Market Report >>>
|
|
|
|
DOW |
-550.46 |
34,678.35 |
-1.56% |
|
Volume |
1,185,148,175 |
+27% |
|
Volume |
5,337,548,200 |
-1% |
|
NASDAQ |
-221.76 |
14,220.52 |
-1.54% |
|
Advancers |
1,317 |
40% |
|
Advancers |
1,726 |
39% |
|
S&P 500 |
-72.04 |
4,530.41 |
-1.57% |
|
Decliners |
1,977 |
60% |
|
Decliners |
2,719 |
61% |
|
Russell 2000 |
-20.94 |
2,070.13 |
-1.00% |
|
52 Wk Highs |
119 |
|
|
52 Wk Highs |
91 |
|
|
S&P 600 |
-13.81 |
1,318.54 |
-1.04% |
|
52 Wk Lows |
73 |
|
|
52 Wk Lows |
125 |
|
|
 |
Major Indices Encounter Pressure and Close Quarter With Losses
Kenneth J. Gruneisen - Passed the CAN SLIM® Master's Exam
The S&P 500 fell 1.6% for the day, and snapped a seven-quarter winning streak with a 5% decline during the January-March period. The Dow slumped 550 points, while the Nasdaq Composite lost 1.5%, with both benchmarks extending their quarterly losses to 4.6% and 9.1%, respectively. Volume totals reported were mixed, highter than the prior session on the NYSE and lighter on the Nasdaq exchange. Breadth was negative as decliners led advancers by a 3-2 margin on the NYSE and on the Nasdaq exchange. There were 46 high-ranked companies from the Leaders List that hit new 52-week highs and were listed on the BreakOuts Page, versus the total of 35 on the prior session. New 52-week highs totals outnumbered new 52-week lows totals on the NYSE, but again new lows outnumbered new highs on the Nasdaq exchange. The recently noted follow-through day confirmed a new uptrend (M criteria). Strict followers of the fact-based investment system only buy stocks fitting all key fundamental and technical investment criteria.
Chart courtesy of www.stockcharts.com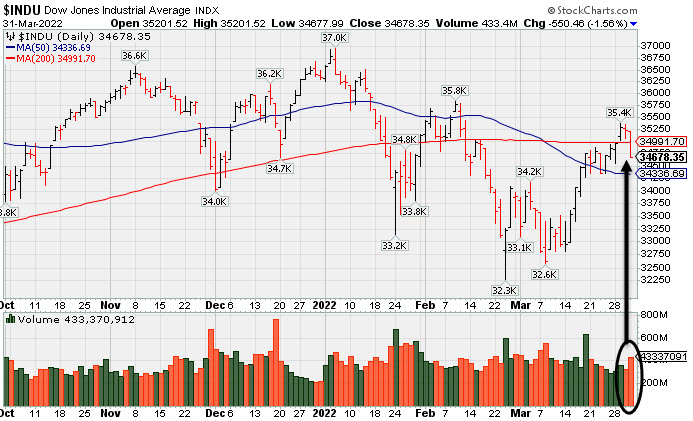 PICTURED: The Dow Jones Industrial Average ended lower Thursday as a loss on higher volume made it slump back below the 200-day moving average (DMA) line, hurting its technical stance. In recent months since peaking, the chart shows a worrisome series of lower highs and lower lows. Subsequent gains above the 200 DMA and above the February high would be a reassuring bullish sign, meanwhile, any further deterioration becomes increasing worrisome for the market outlook.
U.S. equities finished firmly lower on Thursday, capping their worst quarterly performance since 2020. Still, all three major averages notched their first monthly gains of 2022, with the Dow climbing 2.3% in March, the S&P 500 rising 3.6%, and the Nasdaq Composite adding 3.4%.
Treasuries strengthened, with the yield on the 10-year note down one basis point (0.01%) to 2.33%. The benchmark yield declined for a fourth straight session, though posted its largest quarterly gain since 1994 having jumped 0.82% year-to-date. In commodities, West Texas Intermediate crude retreated 6.7% to $100.63/barrel after the Biden administration announced plans to release as much as 180 million barrels of oil from U.S. reserves over the coming months in an effort to ease surging gasoline prices.
All 11 S&P 500 sectors finished in negative territory, with Financials leading laggards. In earnings, Walgreens Boots Alliance Inc. (WBA -5.67%) fell as a stagnant full-year outlook overshadowed otherwise positive quarterly results. Elsewhere, Advanced Micro Devices Inc. (AMD -8.27%) and Dell Technologies (DELL -7.60%) each fell following separate analyst downgrades.
On the data front, the core PCE (personal consumption expenditures) deflator climbed 5.4% year-over-year, posting the biggest jump since 1983 after accelerating from the January’s 5.2% annual increase. Separately, personal income climbed 0.5% last month, while personal spending rose a smaller-than-forecasted 0.2% during the period after surging 2.7% in January.
|
 Kenneth J. Gruneisen started out as a licensed stockbroker in August 1987, a couple of months prior to the historic stock market crash that took the Dow Jones Industrial Average down -22.6% in a single day. He has published daily fact-based fundamental and technical analysis on high-ranked stocks online for two decades. Through FACTBASEDINVESTING.COM, Kenneth provides educational articles, news, market commentary, and other information regarding proven investment systems that work in good times and bad.
Comments contained in the body of this report are technical opinions only and are not necessarily those of Gruneisen Growth Corp. The material herein has been obtained from sources believed to be reliable and accurate, however, its accuracy and completeness cannot be guaranteed. Our firm, employees, and customers may effect transactions, including transactions contrary to any recommendation herein, or have positions in the securities mentioned herein or options with respect thereto. Any recommendation contained in this report may not be suitable for all investors and it is not to be deemed an offer or solicitation on our part with respect to the purchase or sale of any securities. |
|
 |
Financial, Retail, Tech, and Commodity-Linked Groups Fell
Kenneth J. Gruneisen - Passed the CAN SLIM® Master's Exam
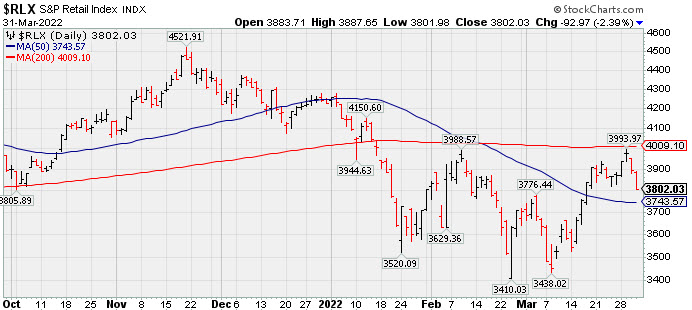
The Bank Index ($BKX -3.09%) and Broker/Dealer Index ($XBD -2.50%) lost ground and weighed on the major averages on Thursday along with the slumping Retail Index ($RLX -2.39%). The Semiconductor Index ($SOX -2.27%) led the tech sector lower while the Biotech Index ($BTK -0.34%) and Networking Index ($NWX -0.44%) each suffered a smaller loss. Commodity-linked groups also slumped as the Oil Services Index ($OSX -1.06%), Integrated Oil Index ($XOI -1.33%), and Gold & Silver Index ($XAU -0.81%) ended unanmously lower. PICTURED: The Retail Index ($RLX -2.39%) pulled back for a 2nd loss after meeting resistance near its 200-day moving average line while rebounding from the Feb/Mar lows.
| Oil Services |
$OSX |
79.96 |
-0.85 |
-1.06% |
+51.67% |
| Integrated Oil |
$XOI |
1,574.84 |
-21.21 |
-1.33% |
+33.66% |
| Semiconductor |
$SOX |
3,429.00 |
-79.62 |
-2.27% |
-13.11% |
| Networking |
$NWX |
893.30 |
-3.94 |
-0.44% |
-8.01% |
| Broker/Dealer |
$XBD |
468.83 |
-12.03 |
-2.50% |
-3.70% |
| Retail |
$RLX |
3,802.03 |
-92.97 |
-2.39% |
-10.04% |
| Gold & Silver |
$XAU |
158.42 |
-1.29 |
-0.81% |
+19.61% |
| Bank |
$BKX |
124.14 |
-3.95 |
-3.09% |
-6.11% |
| Biotech |
$BTK |
5,084.79 |
-17.36 |
-0.34% |
-7.86% |
|
|
|
 |
Featured Stocks
Kenneth J. Gruneisen - Passed the CAN SLIM® Master's Exam
|
|
|
Color Codes Explained :
Y - Better candidates highlighted by our
staff of experts.
G - Previously featured
in past reports as yellow but may no longer be buyable under the
guidelines.
***Last / Change / Volume data in this table is the closing quote data***
Symbol/Exchange
Company Name
Industry Group |
PRICE |
CHANGE
(%Change) |
Day High |
Volume
(% DAV)
(% 50 day avg vol) |
52 Wk Hi
% From Hi |
Featured
Date |
Price
Featured |
Pivot Featured |
|
Max Buy |
 REGN
-
NASDAQ
REGN
-
NASDAQ
Regeneron Pharmaceutical
DRUGS - Biotechnology
|
$698.42
|
+6.04
0.87% |
$710.21
|
1,050,198
140.59% of 50 DAV
50 DAV is 747,000
|
$703.03
-0.66%
|
3/14/2022
|
$647.95
|
PP = $673.96
|
|
MB = $707.66
|
 Most Recent Note - 3/31/2022 5:42:10 PM
Y - Hit another new all-time high today with a gain backed by +41% above average volume, but ended in the lower half of its intra-day range after briefly trading above the "max buy" level. Its 50 DMA line ($637) defines important near-term support to watch on pullbacks.
>>> FEATURED STOCK ARTICLE : 6th Straight Gain Leaves Regeneron Near Record High - 3/16/2022 |
View all notes |
Set NEW NOTE alert |
Company Profile |
SEC
News |
Chart |
Request a new note
C
A
S
I |
TGH
-
NYSE
Textainer Group Holdings
TRANSPORTATION - Logistics
|
$38.07
|
-0.50
-1.30% |
$39.15
|
247,817
52.50% of 50 DAV
50 DAV is 472,000
|
$41.89
-9.12%
|
1/31/2022
|
$36.68
|
PP = $41.34
|
|
MB = $43.41
|
Most Recent Note - 3/31/2022 5:42:52 PM
Y - Volume was below average behind today's 5th consecutive small loss. Still hovering within close striking distance of its all-time high. Color code was changed to yellow after rebounding above its 50 DMA line ($37.76). Any violations would raise serious concerns and trigger technical sell signals. Fundamentals remain strong. See the latest FSU analysis for more detailed analysis and an annotated graph.
>>> FEATURED STOCK ARTICLE : Recently Perched Within Striking Distance of Prior Highs - 3/30/2022 |
View all notes |
Set NEW NOTE alert |
Company Profile |
SEC
News |
Chart |
Request a new note
C
A
S
I |
HWKN
-
NASDAQ
Hawkins Inc
CHEMICALS - Basic Chemicals
|
$45.90
|
-1.17
-2.49% |
$48.12
|
132,818
179.48% of 50 DAV
50 DAV is 74,000
|
$48.05
-4.47%
|
2/3/2022
|
$39.81
|
PP = $41.07
|
|
MB = $43.12
|
Most Recent Note - 3/31/2022 5:38:23 PM
G - There was a "negative reversal" on higher volume today after touching a new all-time high. It has been noted as extended from the previously noted base, with its 50 DMA line ($42.81) defining near-term support to watch.
>>> FEATURED STOCK ARTICLE : Hovering Near High After Rising From Prior Base - 3/15/2022 |
View all notes |
Set NEW NOTE alert |
Company Profile |
SEC
News |
Chart |
Request a new note
C
A
S
I |
IMXI
-
NASDAQ
International Money Exp
Financial Svcs-Specialty
|
$20.61
|
-0.39
-1.86% |
$21.32
|
266,570
80.05% of 50 DAV
50 DAV is 333,000
|
$21.98
-6.23%
|
3/8/2022
|
$18.64
|
PP = $19.06
|
|
MB = $20.01
|
Most Recent Note - 3/31/2022 5:39:49 PM
G - Consolidating well above prior highs in the high $18 area which define initial support to watch.
>>> FEATURED STOCK ARTICLE : Holding Ground After Rallying From Prior Base - 3/24/2022 |
View all notes |
Set NEW NOTE alert |
Company Profile |
SEC
News |
Chart |
Request a new note
C
A
S
I |
|
|
|
THESE ARE NOT BUY RECOMMENDATIONS!
Comments contained in the body of this report are technical
opinions only. The material herein has been obtained
from sources believed to be reliable and accurate, however,
its accuracy and completeness cannot be guaranteed.
This site is not an investment advisor, hence it does
not endorse or recommend any securities or other investments.
Any recommendation contained in this report may not
be suitable for all investors and it is not to be deemed
an offer or solicitation on our part with respect to
the purchase or sale of any securities. All trademarks,
service marks and trade names appearing in this report
are the property of their respective owners, and are
likewise used for identification purposes only.
This report is a service available
only to active Paid Premium Members.
You may opt-out of receiving report notifications
at any time. Questions or comments may be submitted
by writing to Premium Membership Services 665 S.E. 10 Street, Suite 201 Deerfield Beach, FL 33441-5634 or by calling 1-800-965-8307
or 954-785-1121.
|
|
|