You are not logged in.
This means you
CAN ONLY VIEW reports that were published prior to Sunday, February 25, 2024.
You
MUST UPGRADE YOUR MEMBERSHIP if you want to see any current reports.
AFTER MARKET UPDATE - TUESDAY, MARCH 31ST, 2020
Previous After Market Report Next After Market Report >>>
|
|
|
|
DOW |
-410.32 |
21,917.16 |
-1.84% |
|
Volume |
1,747,937,461 |
+41% |
|
Volume |
4,034,711,700 |
+7% |
|
NASDAQ |
-74.05 |
7,700.10 |
-0.95% |
|
Advancers |
1,293 |
45% |
|
Advancers |
1,633 |
50% |
|
S&P 500 |
-42.06 |
2,584.59 |
-1.60% |
|
Decliners |
1,598 |
55% |
|
Decliners |
1,638 |
50% |
|
Russell 2000 |
-5.21 |
1,153.10 |
-0.45% |
|
52 Wk Highs |
5 |
|
|
52 Wk Highs |
18 |
|
|
S&P 600 |
-0.48 |
684.84 |
-0.07% |
|
52 Wk Lows |
29 |
|
|
52 Wk Lows |
46 |
|
|
During market corrections it is especially important to reduce exposure, preserve your capital, and just be patient. Be safe! Historic studies have shown that the biggest up sessions have occurred during market corrections and bear markets.
Disciplined investors know to wait until a new confirmed rally marked by a solid follow-through day. The bold portion of the daily market commentary will note when that happens. For any clarification or additional help applying the fact-based investment system, we invite members to call, or contact us via the inquiry form.
|
 |
Worst Quarter Since 2008 Financial Crisis is Complete
Kenneth J. Gruneisen - Passed the CAN SLIM® Master's Exam
U.S. stocks finished lower on Tuesday, capping the worst quarter for global equities since the 2008 Financial Crisis. The Dow lost 410 points on the session, while the S&P 500 dipped 1.6%. The Nasdaq Composite declined 1%. All three major averages notched double-digit declines for both the month of March and the first quarter. The Dow fell 13.7% for the month and 23.2% in the first three months of 2020 for its worst first-quarter performance on record. The S&P 500 has shed 20% year-to-date, including a 12.5% March retreat. The Nasdaq Composite was down 10.1% this month to cap a 14.2% first-quarter slide. Tuesday's breadth was negative as decliners led advancers by a 7-6 margin on the NYSE while the action was evenly mixed on the Nasdaq exchange. The reported volume totals were higher than the prior session totals on the NYSE and on the Nasdaq exchange, indicative of an increase in distributional selling pressure from the institutional crowd. Leadership remained thin as 2 high-ranked companies from the Leaders List hit new 52-week highs and were listed on the BreakOuts Page, versus 3 on the prior session. New 52-week lows totals still outnumbered the small new 52-week highs totals on both the NYSE and on the Nasdaq exchange. The major indices' (M criteria) have been in a noted "market correction" and investors have been prompted since February 25th to reduce market exposure. Charts used courtesy of www.stockcharts.com
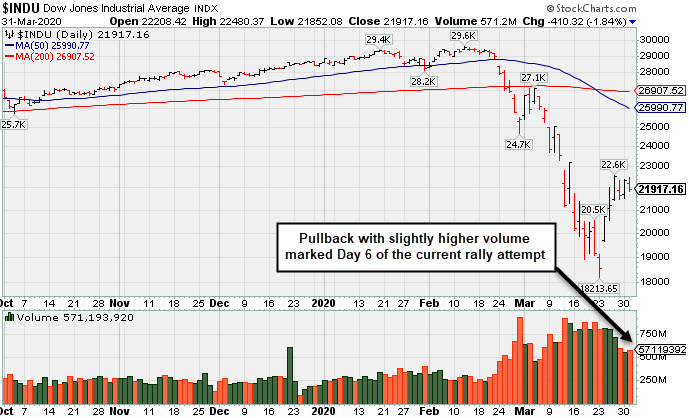
PICTURED: The Dow Jones Industrial Average pulled back with slightly higher volume marking Day 6 of the new rally attempt. Disciplined investors know to watch between Days 4-7 for a follow-through day of big gains from the major indices on higher volume coupled with an increase in the number of stocks hitting new highs to confirm a new market uptrend before initiating any new buying efforts.
Investors continued to weigh unprecedented fiscal and monetary stimulus measures against downbeat economic forecasts as the COVID-19 pandemic lingered. Discussions of a potential fourth stimulus package from Washington circulated, as did reports that President Trump planned to unveil a 90-day deferral of certain tariffs.
Treasuries strengthened, with the yield on the 10-year note down four basis points to 0.67%, having started the month at 1.16%. On the data front, Conference Board’s Consumer Confidence index dropped by the most since 2011 to the lowest point since mid-2017 this month. Overseas, China’s official manufacturing gauge rebounded sharply back into expansionary territory, though the underlying commentary remained cautious.
Ten of 11 S&P 500 sectors closed in negative territory, with Energy the sole advancer amid an uptick in oil prices. WTI crude edged higher but still weathered its worst month and quarter on record. Elsewhere in the commodity space, COMEX gold realized its sixth-straight quarterly gain. |
 Kenneth J. Gruneisen started out as a licensed stockbroker in August 1987, a couple of months prior to the historic stock market crash that took the Dow Jones Industrial Average down -22.6% in a single day. He has published daily fact-based fundamental and technical analysis on high-ranked stocks online for two decades. Through FACTBASEDINVESTING.COM, Kenneth provides educational articles, news, market commentary, and other information regarding proven investment systems that work in good times and bad.
Comments contained in the body of this report are technical opinions only and are not necessarily those of Gruneisen Growth Corp. The material herein has been obtained from sources believed to be reliable and accurate, however, its accuracy and completeness cannot be guaranteed. Our firm, employees, and customers may effect transactions, including transactions contrary to any recommendation herein, or have positions in the securities mentioned herein or options with respect thereto. Any recommendation contained in this report may not be suitable for all investors and it is not to be deemed an offer or solicitation on our part with respect to the purchase or sale of any securities. |
|
 |
Energy-Linked Groups Post Standout Gains on Negative Session
Kenneth J. Gruneisen - Passed the CAN SLIM® Master's Exam
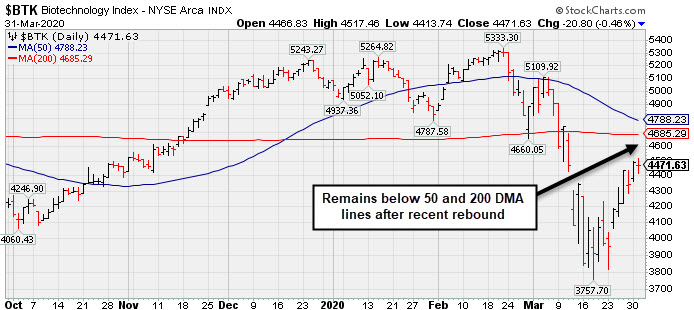
The Retail Index ($RLX -1.47%), Broker/Dealer Index ($XBD -2.07%), and the Bank Index ($BKX -3.58%) fell on Tuesday. The tech sector was unanimously negative as the Semiconductor Index ($SOX -2.25%), Networking Index ($NWX -1.98%) and the Biotech Index ($BTK -0.46%) each fell. Commodity-linked groups were mixed as the Gold & Silver Index ($XAU -1.79%) fell while the Oil Services Index ($OSX +2.05%) and the Integrated Oil Index ($XOI +2.57%) both notched standout gains.
PICTURED: The Biotech Index ($BTK -0.46%) remains below its 50-day and 200-day moving average (DMA) lines.
| Oil Services |
$OSX |
24.73 |
+0.50 |
+2.06% |
-68.41% |
| Integrated Oil |
$XOI |
622.26 |
+15.60 |
+2.57% |
-51.02% |
| Semiconductor |
$SOX |
1,510.59 |
-34.72 |
-2.25% |
-18.33% |
| Networking |
$NWX |
458.78 |
-9.29 |
-1.98% |
-21.36% |
| Broker/Dealer |
$XBD |
213.84 |
-4.52 |
-2.07% |
-26.36% |
| Retail |
$RLX |
2,187.96 |
-32.72 |
-1.47% |
-10.67% |
| Gold & Silver |
$XAU |
78.95 |
-1.44 |
-1.79% |
-26.16% |
| Bank |
$BKX |
65.45 |
-2.43 |
-3.58% |
-42.26% |
| Biotech |
$BTK |
4,471.63 |
-20.80 |
-0.46% |
-11.76% |
|
|
|
 |
No Featured Stocks
Kenneth J. Gruneisen - Passed the CAN SLIM® Master's Exam
During extremely bearish markets the number of stocks covered in this area has sometimes been reduced to zero. We suggest making no excuses for weak stocks in weak markets. Feel free to contact us if you have a need for any additional information. |
|
|
Color Codes Explained :
Y - Better candidates highlighted by our
staff of experts.
G - Previously featured
in past reports as yellow but may no longer be buyable under the
guidelines.
***Last / Change / Volume data in this table is the closing quote data***
|
|
|
THESE ARE NOT BUY RECOMMENDATIONS!
Comments contained in the body of this report are technical
opinions only. The material herein has been obtained
from sources believed to be reliable and accurate, however,
its accuracy and completeness cannot be guaranteed.
This site is not an investment advisor, hence it does
not endorse or recommend any securities or other investments.
Any recommendation contained in this report may not
be suitable for all investors and it is not to be deemed
an offer or solicitation on our part with respect to
the purchase or sale of any securities. All trademarks,
service marks and trade names appearing in this report
are the property of their respective owners, and are
likewise used for identification purposes only.
This report is a service available
only to active Paid Premium Members.
You may opt-out of receiving report notifications
at any time. Questions or comments may be submitted
by writing to Premium Membership Services 665 S.E. 10 Street, Suite 201 Deerfield Beach, FL 33441-5634 or by calling 1-800-965-8307
or 954-785-1121.
|
|
|