You are not logged in.
This means you
CAN ONLY VIEW reports that were published prior to Monday, February 19, 2024.
You
MUST UPGRADE YOUR MEMBERSHIP if you want to see any current reports.
AFTER MARKET UPDATE - WEDNESDAY, MARCH 30TH, 2022
Previous After Market Report Next After Market Report >>>
|
|
|
|
DOW |
-65.38 |
35,228.81 |
-0.19% |
|
Volume |
931,157,812 |
-6% |
|
Volume |
5,409,406,900 |
-11% |
|
NASDAQ |
-177.36 |
14,442.27 |
-1.21% |
|
Advancers |
1,388 |
43% |
|
Advancers |
1,556 |
35% |
|
S&P 500 |
-29.15 |
4,602.45 |
-0.63% |
|
Decliners |
1,849 |
57% |
|
Decliners |
2,929 |
65% |
|
Russell 2000 |
-42.03 |
2,091.07 |
-1.97% |
|
52 Wk Highs |
120 |
|
|
52 Wk Highs |
78 |
|
|
S&P 600 |
-24.98 |
1,332.35 |
-1.84% |
|
52 Wk Lows |
25 |
|
|
52 Wk Lows |
83 |
|
|
 |
Major Indices Pulled Back With Lighter Volume Totals
Kenneth J. Gruneisen - Passed the CAN SLIM® Master's Exam
The S&P 500 fell 0.6%, snapping a four-session winning streak, though the broad benchmark remains within 4.1% of its January record and has climbed over 10% since March 14. The Dow lost 65 points, while the Nasdaq Composite retreated 1.2%. Volume totals reported were lighter than the prior session on the NYSE and on the Nasdaq exchange. Breadth was negative as decliners led advancers by a 9-7 margin on the NYSE and by nearly a 2-1 margin on the Nasdaq exchange. There were 35 high-ranked companies from the Leaders List that hit new 52-week highs and were listed on the BreakOuts Page, versus the total of 42 on the prior session. New 52-week highs totals outnumbered new 52-week lows totals on the NYSE, but new lows outnumbered new highs on the Nasdaq exchange. The recently noted follow-through day confirmed a new uptrend (M criteria). Strict followers of the fact-based investment system only buy stocks fitting all key fundamental and technical investment criteria.
Chart courtesy of www.stockcharts.com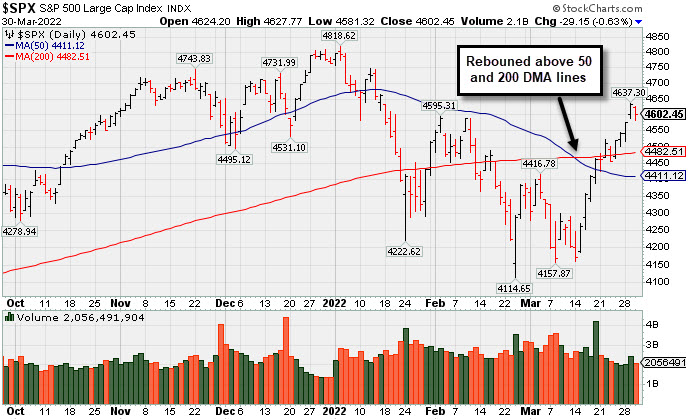 PICTURED: The S & P 500 Index ended lower Wednesday and broke a 4-session winning streak. The recent rebound above both the 50-day and 200-day moving average (DMA) lines helped its technical stance and improved the overall market outlook.
U.S. stocks finished lower on Wednesday, pausing their recent relief rally. Geopolitical updates weighed on sentiment, with the U.S. and its allies remaining skeptical of Russia’s pledge to reduce military activity. Furthermore, Moscow reported no breakthroughs during the latest round of ceasefire talks. West Texas Intermediate crude rebounded 3% to $107.38/barrel, ending a two-day slide.
Seven of 11 S&P 500 sectors closed negative territory, with Consumer Discretionary shares leading the downturn following disappointing earnings. Chewy Inc. (CHWY -16.10%) fell after the pet supply retailer offered a disappointing outlook. RH (RH -13.33%) fell after the home furnishing company flagged weaker demand trends. Meanwhile, apparel maker PVH Corp. (PHV -6.54%) fell on soft guidance amid lingering macro uncertainty and ongoing inflation. Lululemon Athletica Inc. (LULU +9.58%) bucked the downtrend, jumping on improved forecasts. Technology also lagged, with chipmakers particularly weak.
Treasuries strengthened after the yield on the two-year note briefly surpassed the 10-year note yield for the first time since August 2019 on Tuesday. The yield on the longer-dated maturity ended today’s session five basis points (0.05%) lower at 2.34%, while the two-year note yield dipped by the same amount to 2.31%. On the data front, a release revealed private payrolls increased by 455,000 in March. Separately, a final reading of U.S. fourth-quarter GDP reflected a 6.9% annualized growth rate during the October-December period, modestly below the previously reported 7% print.
|
 Kenneth J. Gruneisen started out as a licensed stockbroker in August 1987, a couple of months prior to the historic stock market crash that took the Dow Jones Industrial Average down -22.6% in a single day. He has published daily fact-based fundamental and technical analysis on high-ranked stocks online for two decades. Through FACTBASEDINVESTING.COM, Kenneth provides educational articles, news, market commentary, and other information regarding proven investment systems that work in good times and bad.
Comments contained in the body of this report are technical opinions only and are not necessarily those of Gruneisen Growth Corp. The material herein has been obtained from sources believed to be reliable and accurate, however, its accuracy and completeness cannot be guaranteed. Our firm, employees, and customers may effect transactions, including transactions contrary to any recommendation herein, or have positions in the securities mentioned herein or options with respect thereto. Any recommendation contained in this report may not be suitable for all investors and it is not to be deemed an offer or solicitation on our part with respect to the purchase or sale of any securities. |
|
 |
Retail, Financial, and Tech Groups Fell
Kenneth J. Gruneisen - Passed the CAN SLIM® Master's Exam
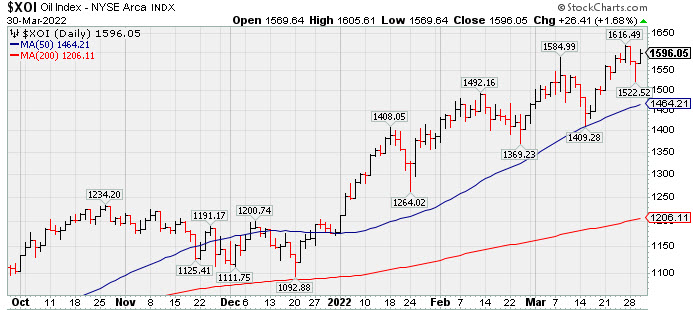
The Retail Index ($RLX -2.02%), Broker/Dealer Index ($XBD -2.19%), and Bank Index ($BKX -2.21%) suffered unanimous losses which weighed on the major averages. The Semiconductor Index ($SOX -3.23%) led the tech sector lower while the Networking Index ($NWX -1.02%) and Biotech Index ($BTK -0.94%) also slumped. Meanwhile, commodity-linked groups had a positive bias as the Gold & Silver Index ($XAU +1.41%), Oil Services Index ($OSX +0.67%), and Integrated Oil Index ($XOI +1.68%) posted unanimous gains. PICTURED: The Integrated Oil Index ($XOI +1.68%) remains perched at multi-year highs.
| Oil Services |
$OSX |
80.81 |
+0.54 |
+0.67% |
+53.29% |
| Integrated Oil |
$XOI |
1,596.05 |
+26.41 |
+1.68% |
+35.47% |
| Semiconductor |
$SOX |
3,508.62 |
-116.96 |
-3.23% |
-11.09% |
| Networking |
$NWX |
897.25 |
-9.21 |
-1.02% |
-7.60% |
| Broker/Dealer |
$XBD |
480.86 |
-10.76 |
-2.19% |
-1.23% |
| Retail |
$RLX |
3,895.00 |
-80.39 |
-2.02% |
-7.84% |
| Gold & Silver |
$XAU |
159.71 |
+2.23 |
+1.41% |
+20.58% |
| Bank |
$BKX |
128.09 |
-2.89 |
-2.21% |
-3.12% |
| Biotech |
$BTK |
5,102.15 |
-48.16 |
-0.94% |
-7.54% |
|
|
|
 |
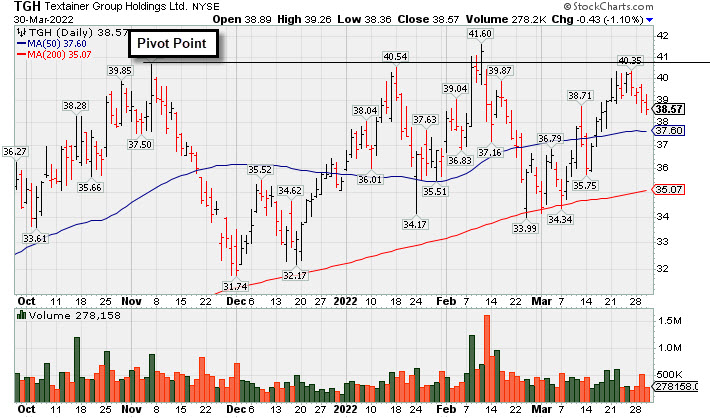
Recently Perched Within Striking Distance of Prior Highs
Kenneth J. Gruneisen - Passed the CAN SLIM® Master's Exam
Textainer Group Holdings (TGH -$0.43 or -1.10% to $38.57) ended lower and volume was below average behind today's 4th consecutive small loss. Volume has been cooling while hovering within close striking distance of its all-time high. The color code was changed to yellow after rebounding above its 50 DMA line ($37.75) since it was last covered in greater detail on 3/14/22 with an annotated graph under the headline, "Slumped Below 50-Day Moving Average Line Toward Prior Lows". Important near-term support to watch is its 200 DMA line ($35.45) and prior lows. Any violations would raise serious concerns and trigger technical sell signals.
TGH was highlighted in yellow with pivot point cited based on its 11/05/21 high plus 10 cents in the 1/31/22 mid-day report (read here). Fundamentals remain strong. TGH has the highest possible Earnings Per Share Rating of 99. It reported Dec '21 quarterly earnings +80% on +23% sales revenues versus the year ago period, its 7th strong earnings comparison. Sales revenues growth has been improving and accelerating in recent quarterly comparisons, a strong match with regard to the fact-based investment system's fundamental guidelines. Annual earnings (A criteria) history has been strong after a downturn and loss in FY '16.
It hails from the Commercial Services - Leasing industry group which is currently ranked 96th on the 197 Industry Groups list (L criteria), down from 72nd a month a ago. There are 49.3 million shares outstanding (S criteria) which can contribute to greater price volatility in the event of institutional buying or selling. The number of top-rated funds owning its shares has risen from 294 in Dec '20 to 341 in Dec '21, a reassuring sign concerning the I criteria. However, its current Up/Down Volume Ratio of 0.8 is an unbiased indication its shares have been under distributional pressure over the past 50 days. It has a Timeliness rating of A and an Accumulation/Distribution rating of C. |
|
|
Color Codes Explained :
Y - Better candidates highlighted by our
staff of experts.
G - Previously featured
in past reports as yellow but may no longer be buyable under the
guidelines.
***Last / Change / Volume data in this table is the closing quote data***
Symbol/Exchange
Company Name
Industry Group |
PRICE |
CHANGE
(%Change) |
Day High |
Volume
(% DAV)
(% 50 day avg vol) |
52 Wk Hi
% From Hi |
Featured
Date |
Price
Featured |
Pivot Featured |
|
Max Buy |
 REGN
-
NASDAQ
REGN
-
NASDAQ
Regeneron Pharmaceutical
DRUGS - Biotechnology
|
$692.38
|
-6.05
-0.87% |
$703.03
|
847,611
113.17% of 50 DAV
50 DAV is 749,000
|
$699.00
-0.95%
|
3/14/2022
|
$647.95
|
PP = $673.96
|
|
MB = $707.66
|
 Most Recent Note - 3/30/2022 5:20:34 PM
Y - There was a "negative reversal" today following 4 consecutive gains for new all-time highs. Still below the "max buy" level. Additional confirming volume-driven gains for new highs would be a reassuring sign of fresh institutional buying demand. Its 50 DMA line ($635) defines important near-term support to watch on pullbacks.
>>> FEATURED STOCK ARTICLE : 6th Straight Gain Leaves Regeneron Near Record High - 3/16/2022 |
View all notes |
Set NEW NOTE alert |
Company Profile |
SEC
News |
Chart |
Request a new note
C
A
S
I |
TGH
-
NYSE
Textainer Group Holdings
TRANSPORTATION - Logistics
|
$38.57
|
-0.43
-1.10% |
$39.26
|
278,158
58.56% of 50 DAV
50 DAV is 475,000
|
$41.89
-7.93%
|
1/31/2022
|
$36.68
|
PP = $41.34
|
|
MB = $43.41
|
Most Recent Note - 3/30/2022 5:18:57 PM
Y - Volume was below average behind today's 4th consecutive small loss. Still hovering within close striking distance of its all-time high. Color code was changed to yellow after rebounding above its 50 DMA line ($37.75). Any violations would raise serious concerns and trigger technical sell signals. Fundamentals remain strong. See the latest FSU analysis for more detailed analysis and a new annotated graph.
>>> FEATURED STOCK ARTICLE : Recently Perched Within Striking Distance of Prior Highs - 3/30/2022 |
View all notes |
Set NEW NOTE alert |
Company Profile |
SEC
News |
Chart |
Request a new note
C
A
S
I |
HWKN
-
NASDAQ
Hawkins Inc
CHEMICALS - Basic Chemicals
|
$47.07
|
+1.16
2.53% |
$47.76
|
87,334
119.64% of 50 DAV
50 DAV is 73,000
|
$48.05
-2.04%
|
2/3/2022
|
$39.81
|
PP = $41.07
|
|
MB = $43.12
|
Most Recent Note - 3/30/2022 5:17:14 PM
G - Posted a 2nd consecutive gain closing near its all-time, still extended from the previously noted base. Its 50 DMA line ($42.65) defines initial support to watch above prior highs in the $40 area.
>>> FEATURED STOCK ARTICLE : Hovering Near High After Rising From Prior Base - 3/15/2022 |
View all notes |
Set NEW NOTE alert |
Company Profile |
SEC
News |
Chart |
Request a new note
C
A
S
I |
IMXI
-
NASDAQ
International Money Exp
Financial Svcs-Specialty
|
$21.00
|
-0.07
-0.33% |
$21.70
|
443,723
134.06% of 50 DAV
50 DAV is 331,000
|
$21.98
-4.46%
|
3/8/2022
|
$18.64
|
PP = $19.06
|
|
MB = $20.01
|
Most Recent Note - 3/30/2022 5:21:46 PM
G - Still holding its ground stubbornly near its all-time, extended from prior highs in the high $18 area which define initial support to watch.
>>> FEATURED STOCK ARTICLE : Holding Ground After Rallying From Prior Base - 3/24/2022 |
View all notes |
Set NEW NOTE alert |
Company Profile |
SEC
News |
Chart |
Request a new note
C
A
S
I |
|
|
|
THESE ARE NOT BUY RECOMMENDATIONS!
Comments contained in the body of this report are technical
opinions only. The material herein has been obtained
from sources believed to be reliable and accurate, however,
its accuracy and completeness cannot be guaranteed.
This site is not an investment advisor, hence it does
not endorse or recommend any securities or other investments.
Any recommendation contained in this report may not
be suitable for all investors and it is not to be deemed
an offer or solicitation on our part with respect to
the purchase or sale of any securities. All trademarks,
service marks and trade names appearing in this report
are the property of their respective owners, and are
likewise used for identification purposes only.
This report is a service available
only to active Paid Premium Members.
You may opt-out of receiving report notifications
at any time. Questions or comments may be submitted
by writing to Premium Membership Services 665 S.E. 10 Street, Suite 201 Deerfield Beach, FL 33441-5634 or by calling 1-800-965-8307
or 954-785-1121.
|
|
|