You are not logged in.
This means you
CAN ONLY VIEW reports that were published prior to Sunday, February 25, 2024.
You
MUST UPGRADE YOUR MEMBERSHIP if you want to see any current reports.
AFTER MARKET UPDATE - MONDAY, MARCH 30TH, 2020
Previous After Market Report Next After Market Report >>>
|
|
|
|
DOW |
+690.70 |
22,327.48 |
+3.19% |
|
Volume |
1,242,736,937 |
-8% |
|
Volume |
3,782,732,900 |
-4% |
|
NASDAQ |
+271.77 |
7,774.15 |
+3.62% |
|
Advancers |
1,775 |
60% |
|
Advancers |
2,042 |
63% |
|
S&P 500 |
+85.18 |
2,626.65 |
+3.35% |
|
Decliners |
1,174 |
40% |
|
Decliners |
1,222 |
37% |
|
Russell 2000 |
+26.33 |
1,158.32 |
+2.33% |
|
52 Wk Highs |
5 |
|
|
52 Wk Highs |
15 |
|
|
S&P 600 |
+15.44 |
685.32 |
+2.30% |
|
52 Wk Lows |
59 |
|
|
52 Wk Lows |
41 |
|
|
During market corrections it is especially important to reduce exposure, preserve your capital, and just be patient. Be safe! Historic studies have shown that the biggest up sessions have occurred during market corrections and bear markets.
Disciplined investors know to wait until a new confirmed rally marked by a solid follow-through day. The bold portion of the daily market commentary will note when that happens. For any clarification or additional help applying the fact-based investment system, we invite members to call, or contact us via the inquiry form.
|
 |
Major Indices Rose With Less Volume Conviction
Kenneth J. Gruneisen - Passed the CAN SLIM® Master's Exam
The Dow climbed 690 points, while the S&P 500 gained 3.4%. The Nasdaq Composite was up 3.6%. Breadth was positive as advancers led decliners by a 3-2 margin on the NYSE and 5-3 on the Nasdaq exchange. The reported volume totals were lighter than the prior session totals on the NYSE and on the Nasdaq exchange, not suggesting an increase in buying demand coming from the institutional crowd. Leadership remained thin as 3 high-ranked companies from the Leaders List hit new 52-week highs and were listed on the BreakOuts Page, up from 1 on the prior session. New 52-week lows totals still outnumbered the small new 52-week highs totals on both the NYSE and on the Nasdaq exchange. The major indices' (M criteria) have been in a noted "market correction" and investors have been prompted since February 25th to reduce market exposure. Charts used courtesy of www.stockcharts.com
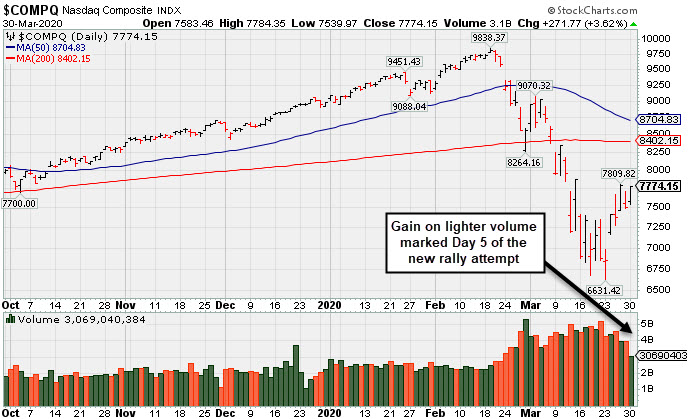
PICTURED: The Nasdaq Composite Index posted a gain with lighter volume marking Day 5 of the new rally attempt. Disciplined investors know to watch between Days 4-7 for a follow-through day of big gains from the major indices on higher volume coupled with an increase in the number of stocks hitting new highs to confirm a new market uptrend before initiating any new buying efforts.
Stocks finished higher Monday, extending last week’s rally that included the best three-day stretch for U.S. equities in 90 years. Investors digested COVID-19 updates and assessed whether or not the latest fiscal and monetary stimulus measures would sufficiently cushion an economic downturn. On Sunday, President Trump recommended that U.S. social distancing guidelines last through the end of April.
All 11 S&P 500 sectors closed in positive territory. Health Care shares paced gains, with coronavirus updates in focus. Abbott Laboratories (ABT +6.41%) rose after unveiling a 5-minute diagnostic test, while Johnson & Johnson (JNJ +8.0%) rose following an announcement that clinical trials on a lead vaccine candidate would start by September. The Technology sector also led advancers, with Microsoft (MSFT +7.03%) rose on news that the company has observed a 775% surge in demand for its cloud services in areas enforcing social distancing measures. Elsewhere, cruise line operators lagged, as several were subject to sizable analyst price target decreases.
On the data front, pending home sales rose 2.4% in February, exceeding forecasts of a 1.7% decline. Separately, a release from the Dallas Fed revealed manufacturing activity in the region plummeted in March to a record low. Treasuries erased morning gains, with the yield on the 10-year note ending up three basis points to 0.71%. In commodities, WTI crude slumped 6.6% after earlier dipping below $20.00/barrel to an 18-year low. A gauge of the U.S. dollar snapped a four-session losing streak. |
 Kenneth J. Gruneisen started out as a licensed stockbroker in August 1987, a couple of months prior to the historic stock market crash that took the Dow Jones Industrial Average down -22.6% in a single day. He has published daily fact-based fundamental and technical analysis on high-ranked stocks online for two decades. Through FACTBASEDINVESTING.COM, Kenneth provides educational articles, news, market commentary, and other information regarding proven investment systems that work in good times and bad.
Comments contained in the body of this report are technical opinions only and are not necessarily those of Gruneisen Growth Corp. The material herein has been obtained from sources believed to be reliable and accurate, however, its accuracy and completeness cannot be guaranteed. Our firm, employees, and customers may effect transactions, including transactions contrary to any recommendation herein, or have positions in the securities mentioned herein or options with respect thereto. Any recommendation contained in this report may not be suitable for all investors and it is not to be deemed an offer or solicitation on our part with respect to the purchase or sale of any securities. |
|
 |
Tech, Retail, and Financial Indexes Rose
Kenneth J. Gruneisen - Passed the CAN SLIM® Master's Exam
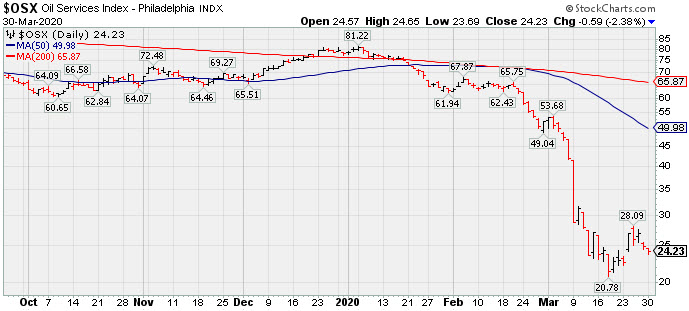
The Retail Index ($RLX +2.69%) and Broker/Dealer Index ($XBD +1.80%) both outpaced the Bank Index ($BKX +0.39%) on Monday. The tech sector was unanimously positive as the Semiconductor Index ($SOX +3.80%), Networking Index ($NWX +3.17%) and the Biotech Index ($BTK +3.51%) each posted solid gains of greater than +3%. Commodity-linked groups were mostly weak as the Gold & Silver Index ($XAU -1.73%) and Oil Services Index ($OSX -2.38%) both lost ground, meanwhile the Integrated Oil Index ($XOI +2.60%) notched a solid gain.
PICTURED: The Oil Services Index ($OSX -2.38%) pulled back on Monday, still sputtering near multi-year lows.
| Oil Services |
$OSX |
24.23 |
-0.59 |
-2.38% |
-69.05% |
| Integrated Oil |
$XOI |
606.66 |
+15.39 |
+2.60% |
-52.25% |
| Semiconductor |
$SOX |
1,545.31 |
+56.56 |
+3.80% |
-16.45% |
| Networking |
$NWX |
468.07 |
+14.40 |
+3.17% |
-19.77% |
| Broker/Dealer |
$XBD |
218.36 |
+3.86 |
+1.80% |
-24.80% |
| Retail |
$RLX |
2,220.68 |
+58.27 |
+2.69% |
-9.33% |
| Gold & Silver |
$XAU |
80.39 |
-1.42 |
-1.74% |
-24.81% |
| Bank |
$BKX |
67.88 |
+0.27 |
+0.40% |
-40.12% |
| Biotech |
$BTK |
4,492.43 |
+152.50 |
+3.51% |
-11.35% |
|
|
|
 |
No Featured Stocks
Kenneth J. Gruneisen - Passed the CAN SLIM® Master's Exam
During extremely bearish markets the number of stocks covered in this area has sometimes been reduced to zero. We suggest making no excuses for weak stocks in weak markets. Feel free to contact us if you have a need for any additional information. |
|
|
Color Codes Explained :
Y - Better candidates highlighted by our
staff of experts.
G - Previously featured
in past reports as yellow but may no longer be buyable under the
guidelines.
***Last / Change / Volume data in this table is the closing quote data***
|
|
|
THESE ARE NOT BUY RECOMMENDATIONS!
Comments contained in the body of this report are technical
opinions only. The material herein has been obtained
from sources believed to be reliable and accurate, however,
its accuracy and completeness cannot be guaranteed.
This site is not an investment advisor, hence it does
not endorse or recommend any securities or other investments.
Any recommendation contained in this report may not
be suitable for all investors and it is not to be deemed
an offer or solicitation on our part with respect to
the purchase or sale of any securities. All trademarks,
service marks and trade names appearing in this report
are the property of their respective owners, and are
likewise used for identification purposes only.
This report is a service available
only to active Paid Premium Members.
You may opt-out of receiving report notifications
at any time. Questions or comments may be submitted
by writing to Premium Membership Services 665 S.E. 10 Street, Suite 201 Deerfield Beach, FL 33441-5634 or by calling 1-800-965-8307
or 954-785-1121.
|
|
|