You are not logged in.
This means you
CAN ONLY VIEW reports that were published prior to Friday, February 23, 2024.
You
MUST UPGRADE YOUR MEMBERSHIP if you want to see any current reports.
AFTER MARKET UPDATE - TUESDAY, MARCH 29TH, 2022
Previous After Market Report Next After Market Report >>>
|
|
|
|
DOW |
+338.30 |
35,294.19 |
+0.97% |
|
Volume |
995,405,373 |
+16% |
|
Volume |
6,082,904,200 |
+21% |
|
NASDAQ |
+264.73 |
14,619.64 |
+1.84% |
|
Advancers |
2,651 |
81% |
|
Advancers |
3,222 |
72% |
|
S&P 500 |
+56.08 |
4,631.60 |
+1.23% |
|
Decliners |
631 |
19% |
|
Decliners |
1,267 |
28% |
|
Russell 2000 |
+55.04 |
2,133.10 |
+2.65% |
|
52 Wk Highs |
117 |
|
|
52 Wk Highs |
92 |
|
|
S&P 600 |
+31.72 |
1,357.33 |
+2.39% |
|
52 Wk Lows |
74 |
|
|
52 Wk Lows |
78 |
|
|
 |
Major Averages Rose With Greater Leadership and Higher Volume
Kenneth J. Gruneisen - Passed the CAN SLIM® Master's Exam
The S&P 500 climbed 1.2%, closing within 3.5% of its January 3 record. The Nasdaq Composite rallied 1.8%, while the Dow jumped 338 points. Volume totals reported were higher than the prior session on the NYSE and on the Nasdaq exchange, indicative of an increase in institutional buying efforts. Breadth was solidly positive as advancers led decliners by more than a 4-1 margin on the NYSE and by an 8-3 margin on the Nasdaq exchange. Leadership improved as there were 42 high-ranked companies from the Leaders List that hit new 52-week highs and were listed on the BreakOuts Page, doubling the total of 21 on the prior session. New 52-week highs totals expanded and outnumbered shrinking new 52-week lows totals on both the NYSE and the Nasdaq exchange. The recently noted follow-through day confirmed a new uptrend (M criteria). Strict followers of the fact-based investment system only buy stocks fitting all key fundamental and technical investment criteria.
Chart courtesy of www.stockcharts.com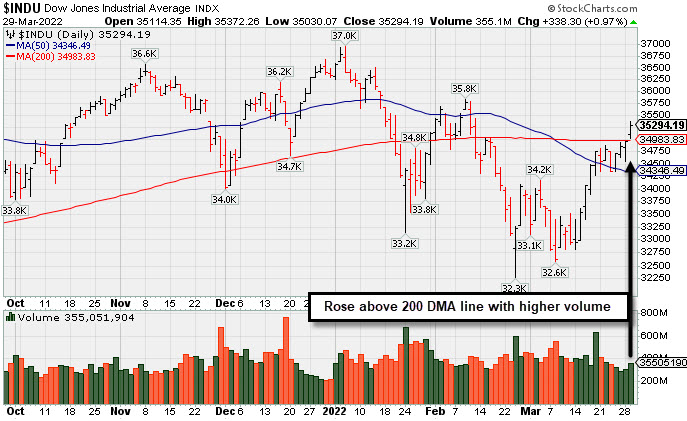 PICTURED: The Dow Jones Industrial Average posted a gain backed by higher volume while rebounding above its 200-day moving average (DMA) line. That helped its technical stance and improved the overall market outlook.
U.S. stocks finished firmly higher on Tuesday, extending upward momentum into a fourth session. Optimism over today’s ceasefire talks between top Russian and Ukrainian officials was cited as supporting sentiment. Moscow said it would “drastically reduce” military activity near Kyiv, while Ukrainian officials signaled openness to a neutral status as part of a peace deal. West Texas Intermediate crude slipped 0.9% to $105.00/barrel.
Still, concerns over the economic growth outlook lingered as some portions of the U.S. Treasury yield curve remained inverted. Notably, the yield on the two-year note briefly surpassed the 10-year note yield for the first time since August 2019. The longer-dated yield settled down six basis points (0.06%) to 2.39%, while the more Fed-sensitive yield advanced three basis points (0.03%) to 2.36%.
Ten of 11 S&P 500 sectors closed in positive territory, with Energy the lone laggard. Growth-related shares outperformed, with Apple Inc. rising for an 11th consecutive session, notching its longest winning stretch since 2003 and turning positive year-to-date. In corporate news, Nielsen Holdings PLC surged more than 20% after being bought by a private-equity consortium for $16 billion.
On the data front, the Conference Board’s gauge of consumer confidence improved to 107.2 in March from the prior month’s downwardly revised 105.7 print, which had been the lowest reading in a year. Separately, the Jobs Openings and Labor Turnover Survey (JOLTS) revealed available positions eased slightly in February to nearly 11.3 million.
|
 Kenneth J. Gruneisen started out as a licensed stockbroker in August 1987, a couple of months prior to the historic stock market crash that took the Dow Jones Industrial Average down -22.6% in a single day. He has published daily fact-based fundamental and technical analysis on high-ranked stocks online for two decades. Through FACTBASEDINVESTING.COM, Kenneth provides educational articles, news, market commentary, and other information regarding proven investment systems that work in good times and bad.
Comments contained in the body of this report are technical opinions only and are not necessarily those of Gruneisen Growth Corp. The material herein has been obtained from sources believed to be reliable and accurate, however, its accuracy and completeness cannot be guaranteed. Our firm, employees, and customers may effect transactions, including transactions contrary to any recommendation herein, or have positions in the securities mentioned herein or options with respect thereto. Any recommendation contained in this report may not be suitable for all investors and it is not to be deemed an offer or solicitation on our part with respect to the purchase or sale of any securities. |
|
 |
Tech, Financial, Retail, and Commodity-Linked Groups Rose
Kenneth J. Gruneisen - Passed the CAN SLIM® Master's Exam
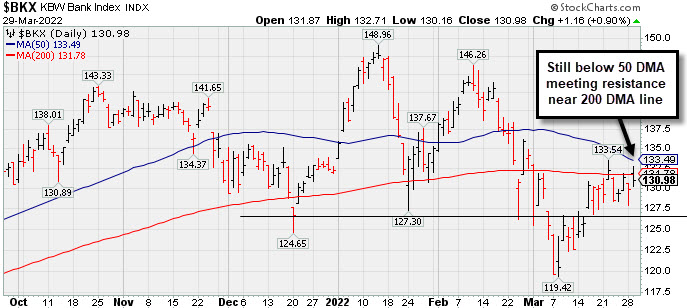
The Broker/Dealer Index ($XBD +2.27%) and Bank Index ($BKX +0.90%) posted influential gains along with the Retail Index ($RLX +0.98%). The tech sector had a positive bias with unanimous gains from the Semiconductor Index ($SOX +2.21%), Biotech Index ($BTK +2.46%), and Networking Index ($NWX +1.44%). The Oil Services Index ($OSX +1.70%) posted a solid gain and the Gold & Silver Index ($XAU +0.85%) also rose, but the Integrated Oil Index ($XOI -0.31%) ended slightly lower on the session. PICTURED: The Bank Index ($BKX +0.90%) halted its slide soon after undercutting its December low. It remains below its 50-day moving average (DMA) and it has recently been meeting resistance near its 200 DMA line. Longtime readers know that the Financial indexes are very important leading indicators. Near-term improvement above both of those moving averages would be a reassuring sign, but any further deterioration would be a worrisome for the current market rally.
| Oil Services |
$OSX |
80.27 |
+1.34 |
+1.70% |
+52.27% |
| Integrated Oil |
$XOI |
1,569.64 |
-4.89 |
-0.31% |
+33.22% |
| Semiconductor |
$SOX |
3,625.58 |
+78.41 |
+2.21% |
-8.12% |
| Networking |
$NWX |
906.45 |
+12.85 |
+1.44% |
-6.66% |
| Broker/Dealer |
$XBD |
491.62 |
+10.89 |
+2.27% |
+0.98% |
| Retail |
$RLX |
3,975.39 |
+38.55 |
+0.98% |
-5.94% |
| Gold & Silver |
$XAU |
157.48 |
+1.32 |
+0.85% |
+18.90% |
| Bank |
$BKX |
130.98 |
+1.16 |
+0.90% |
-0.94% |
| Biotech |
$BTK |
5,150.30 |
+123.44 |
+2.46% |
-6.67% |
|
|
|
 |
Featured Stocks
Kenneth J. Gruneisen - Passed the CAN SLIM® Master's Exam
|
|
|
Color Codes Explained :
Y - Better candidates highlighted by our
staff of experts.
G - Previously featured
in past reports as yellow but may no longer be buyable under the
guidelines.
***Last / Change / Volume data in this table is the closing quote data***
|
|
|
THESE ARE NOT BUY RECOMMENDATIONS!
Comments contained in the body of this report are technical
opinions only. The material herein has been obtained
from sources believed to be reliable and accurate, however,
its accuracy and completeness cannot be guaranteed.
This site is not an investment advisor, hence it does
not endorse or recommend any securities or other investments.
Any recommendation contained in this report may not
be suitable for all investors and it is not to be deemed
an offer or solicitation on our part with respect to
the purchase or sale of any securities. All trademarks,
service marks and trade names appearing in this report
are the property of their respective owners, and are
likewise used for identification purposes only.
This report is a service available
only to active Paid Premium Members.
You may opt-out of receiving report notifications
at any time. Questions or comments may be submitted
by writing to Premium Membership Services 665 S.E. 10 Street, Suite 201 Deerfield Beach, FL 33441-5634 or by calling 1-800-965-8307
or 954-785-1121.
|
|
|