You are not logged in.
This means you
CAN ONLY VIEW reports that were published prior to Sunday, February 25, 2024.
You
MUST UPGRADE YOUR MEMBERSHIP if you want to see any current reports.
AFTER MARKET UPDATE - MONDAY, MARCH 28TH, 2022
Previous After Market Report Next After Market Report >>>
|
|
|
|
DOW |
+94.65 |
34,955.89 |
+0.27% |
|
Volume |
856,857,649 |
-2% |
|
Volume |
5,027,053,300 |
-9% |
|
NASDAQ |
+185.60 |
14,354.90 |
+1.31% |
|
Advancers |
1,636 |
50% |
|
Advancers |
2,207 |
48% |
|
S&P 500 |
+32.46 |
4,575.52 |
+0.71% |
|
Decliners |
1,648 |
50% |
|
Decliners |
2,400 |
52% |
|
Russell 2000 |
+0.08 |
2,078.06 |
+0.00% |
|
52 Wk Highs |
75 |
|
|
52 Wk Highs |
67 |
|
|
S&P 600 |
-5.41 |
1,325.61 |
-0.41% |
|
52 Wk Lows |
139 |
|
|
52 Wk Lows |
162 |
|
|
 |
Leadership Thinned as Broader Market Showed Mixed Action
Kenneth J. Gruneisen - Passed the CAN SLIM® Master's Exam
The S&P 500 climbed 0.7%, back within 4.7% of its January 3 record, while the Dow added 94 points. The Nasdaq Composite jumped 1.3% amid strength in tech-related shares. Volume totals reported were lighter than the prior session on the NYSE and on the Nasdaq exchange, hinting at a decrease in institutional buying efforts. Advancers and decliners were evenly matched on the NYSE, meanwhile decliners led advancers by a narrow margin on the Nasdaq exchange. Leadership thinned as there were 27 high-ranked companies from the Leaders List that hit new 52-week highs and were listed on the BreakOuts Page, versus the total of 61 on the prior session. New 52-week lows again outnumbered shrinking new 52-week highs totals on both the NYSE and the Nasdaq exchange. The recently noted follow-through day confirmed a new uptrend (M criteria). Strict followers of the fact-based investment system only buy stocks fitting all key fundamental and technical investment criteria.
Chart courtesy of www.stockcharts.com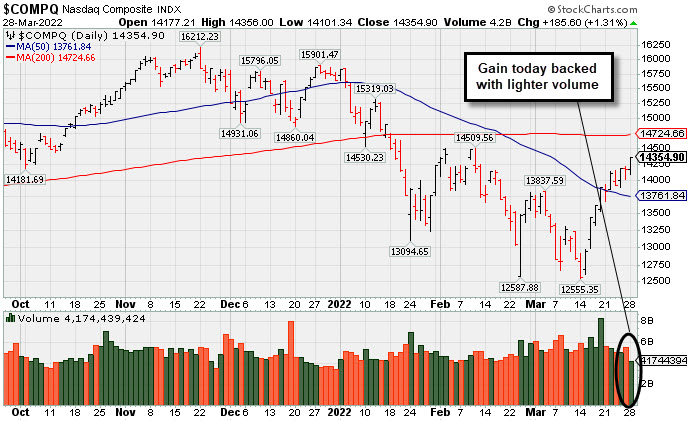 PICTURED: The Nasdaq Composite Index posted a gain backed by lighter volume while approaching February highs. The recent rebound above its 50-day moving average (DMA) line helped its technical stance and improved the outlook.
U.S. stocks finished near their best levels of the session on Monday, extending a two-week winning streak. Notably, the CBOE Volatility Index (VIX) settled below 20 for the first time since mid-January. Oil prices eased, with West Texas Intermediate crude falling 9.4% to $103.25/barrel amid worries that COVID-19-related lockdowns in China would pressure demand.
Concerns over the economic growth outlook lingered as some portions of the U.S. Treasury yield curve inverted--a scenario in which shorter-term yields surpass longer-term rates. The spread between five-year notes and 30-year bonds briefly turned negative for the first time since 2006. The yield on the 10-year note ended three basis points (0.03%) lower at 2.45%. On the data front, an update from the Dallas Fed showed manufacturing activity in the region deteriorated more than projected in March. In geopolitical news, investors eyed the next round of ceasefire talks between top Russian and Ukrainian officials, slated for tomorrow.
Eight of 11 S&P 500 sectors closed in positive territory, with cyclical-oriented groups lagging. Consumer Discretionary shares outperformed, with Tesla Inc. (TSLA +8.03%) gapped up after taking steps to enable a stock split and eventual dividend payout. Technology was also among the standouts. Apple Inc. (AAPL 0.50%) edged higher despite planning to reduce production of its iPhone SE by 20% next quarter. In the M&A space, communications technology company Poly - formerly Plantronics Inc. (POLY +52.63%) gapped up after agreeing to be acquired by HP Inc. (HPQ -2.74%) for $3.3 billion.
|
 Kenneth J. Gruneisen started out as a licensed stockbroker in August 1987, a couple of months prior to the historic stock market crash that took the Dow Jones Industrial Average down -22.6% in a single day. He has published daily fact-based fundamental and technical analysis on high-ranked stocks online for two decades. Through FACTBASEDINVESTING.COM, Kenneth provides educational articles, news, market commentary, and other information regarding proven investment systems that work in good times and bad.
Comments contained in the body of this report are technical opinions only and are not necessarily those of Gruneisen Growth Corp. The material herein has been obtained from sources believed to be reliable and accurate, however, its accuracy and completeness cannot be guaranteed. Our firm, employees, and customers may effect transactions, including transactions contrary to any recommendation herein, or have positions in the securities mentioned herein or options with respect thereto. Any recommendation contained in this report may not be suitable for all investors and it is not to be deemed an offer or solicitation on our part with respect to the purchase or sale of any securities. |
|
 |
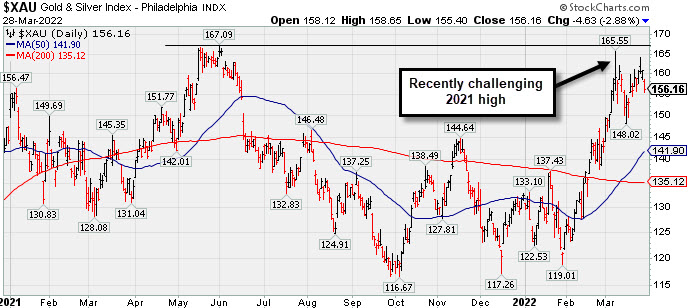
Retail, Semiconductor Index Rose; Commodity-Linked Groups Fell
Kenneth J. Gruneisen - Passed the CAN SLIM® Master's Exam
The Retail Index ($RLX +1.79%) posted a solid gain while the Broker/Dealer Index ($XBD +0.02%) finished flat and the Bank Index ($BKX -1.16%) lost ground. The Semiconductor Index ($SOX +0.62%) posted a modest gain while the Biotech Index ($BTK -0.01%) and Networking Index ($NWX -0.10%) were little changed. Meanwhile, commodity-linked groups had a negative bias as the Oil Services Index ($OSX -4.41%), Integrated Oil Index ($XOI -2.49%), and Gold & Silver Index ($XAU -2.88%) each suffered large losses. PICTURED: The Gold & Silver Index ($XAU -2.88%) pulled back on Monday. It rebounded impressively above its 50-day and 200-day moving average (DMA) lines since the beginning of the year, and recently it has been challenging its 2021 high.
| Oil Services |
$OSX |
78.93 |
-3.64 |
-4.41% |
+49.72% |
| Integrated Oil |
$XOI |
1,574.53 |
-40.13 |
-2.49% |
+33.64% |
| Semiconductor |
$SOX |
3,547.17 |
+21.83 |
+0.62% |
-10.11% |
| Networking |
$NWX |
893.60 |
-0.88 |
-0.10% |
-7.98% |
| Broker/Dealer |
$XBD |
480.73 |
+0.11 |
+0.02% |
-1.26% |
| Retail |
$RLX |
3,936.84 |
+69.28 |
+1.79% |
-6.85% |
| Gold & Silver |
$XAU |
156.16 |
-4.63 |
-2.88% |
+17.90% |
| Bank |
$BKX |
129.82 |
-1.52 |
-1.16% |
-1.82% |
| Biotech |
$BTK |
5,026.87 |
-0.60 |
-0.01% |
-8.91% |
|
|
|
 |
Featured Stocks
Kenneth J. Gruneisen - Passed the CAN SLIM® Master's Exam
|
|
|
Color Codes Explained :
Y - Better candidates highlighted by our
staff of experts.
G - Previously featured
in past reports as yellow but may no longer be buyable under the
guidelines.
***Last / Change / Volume data in this table is the closing quote data***
|
|
|
THESE ARE NOT BUY RECOMMENDATIONS!
Comments contained in the body of this report are technical
opinions only. The material herein has been obtained
from sources believed to be reliable and accurate, however,
its accuracy and completeness cannot be guaranteed.
This site is not an investment advisor, hence it does
not endorse or recommend any securities or other investments.
Any recommendation contained in this report may not
be suitable for all investors and it is not to be deemed
an offer or solicitation on our part with respect to
the purchase or sale of any securities. All trademarks,
service marks and trade names appearing in this report
are the property of their respective owners, and are
likewise used for identification purposes only.
This report is a service available
only to active Paid Premium Members.
You may opt-out of receiving report notifications
at any time. Questions or comments may be submitted
by writing to Premium Membership Services 665 S.E. 10 Street, Suite 201 Deerfield Beach, FL 33441-5634 or by calling 1-800-965-8307
or 954-785-1121.
|
|
|