You are not logged in.
This means you
CAN ONLY VIEW reports that were published prior to Sunday, February 25, 2024.
You
MUST UPGRADE YOUR MEMBERSHIP if you want to see any current reports.
AFTER MARKET UPDATE - THURSDAY, MARCH 26TH, 2020
Previous After Market Report Next After Market Report >>>
|
|
|
|
DOW |
+1,351.62 |
22,552.17 |
+6.38% |
|
Volume |
1,624,433,678 |
-10% |
|
Volume |
3,983,248,700 |
-15% |
|
NASDAQ |
+413.24 |
7,797.54 |
+5.60% |
|
Advancers |
2,578 |
87% |
|
Advancers |
2,719 |
83% |
|
S&P 500 |
+154.51 |
2,630.07 |
+6.24% |
|
Decliners |
382 |
13% |
|
Decliners |
556 |
17% |
|
Russell 2000 |
+69.95 |
1,180.32 |
+6.30% |
|
52 Wk Highs |
4 |
|
|
52 Wk Highs |
5 |
|
|
S&P 600 |
+45.26 |
700.66 |
+6.91% |
|
52 Wk Lows |
21 |
|
|
52 Wk Lows |
31 |
|
|
During market corrections it is especially important to reduce exposure, preserve your capital, and just be patient. Be safe! Historic studies have shown that the biggest up sessions have occurred during market corrections and bear markets.
Disciplined investors know to wait until a new confirmed rally marked by a solid follow-through day. The bold portion of the daily market commentary will note when that happens. For any clarification or additional help applying the fact-based investment system, we invite members to call, or contact us via the inquiry form.
|
 |
Indices Rise With Lighter Volume as Leadership Remains Elusive
Kenneth J. Gruneisen - Passed the CAN SLIM® Master's Exam
The Dow surged 1,351 points, notching its best three-day performance since 1931, up 21.3% from March 23rd. The S&P 500 gained 6.2% for its third straight daily advance, while the Nasdaq Composite rose 5.6%. Breadth was positive as advancers led decliners by more than a 6-1 margin on the NYSE and nearly 5-1 on the Nasdaq exchange. The reported volume totals were lighter than the prior session totals on the NYSE and on the Nasdaq exchange. Leadership remained elusive as zero high-ranked companies from the Leaders List hit a new 52-week high and were listed on the BreakOuts Page. New 52-week lows totals contracted yet still outnumbered new 52-week highs totals which were in the single digits on both the NYSE and on the Nasdaq exchange. The major indices' (M criteria) have been in a noted "market correction" and investors have been prompted since February 25th to reduce market exposure. Charts used courtesy of www.stockcharts.com
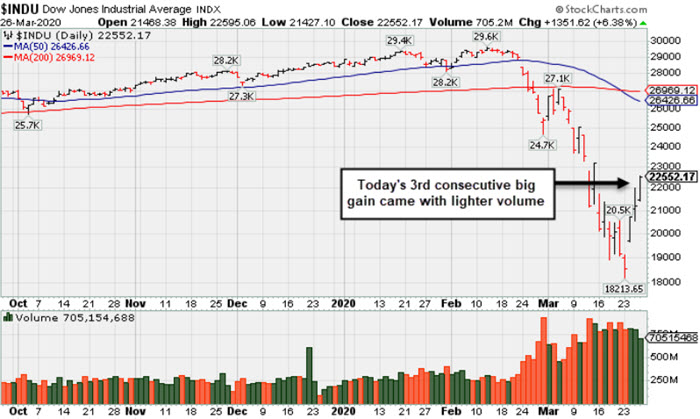
PICTURED: The Dow Jones Industrial Average posted a solid gain with lighter volume on Day 3 of a new rally attempt. Disciplined investors know to watch between Days 4-7 for a follow-through day of big gains from the major indices on higher volume coupled with an increase in the number of stocks hitting new highs to confirm a new market uptrend before initiating any new buying efforts.
Stocks finished firmly higher Thursday as investors weighed fiscal stimulus plans against a record initial jobless claims figure. Last night, the Senate unanimously passed a $2 trillion spending package to help citizens and businesses deal with the economic fallout from the coronavirus outbreak. The bill now moves to the House for a final vote before heading to President Trump.
On the data front, initial jobless claims spiked to a record high of 3.3 million in the most recent week, nearly doubling economists’ consensus forecasts and blowing past the high during the 2008 Financial Crisis of 665,000. In central bank news, Fed Chair Jerome Powell noted that the U.S. economy “may well be in recession” but signaled willingness to add to the monetary stimulus already in place if warranted. Treasuries advanced with the yield on the 10-year note falling two basis points to 0.82%. In commodities, WTI crude fell 7.7% to $22.60/barrel as demand continues to shrink.
All 11 S&P 500 sectors ended the session in positive territory. The more traditionally defensive sectors paced gains, with Utilities and Real Estate both advancing more than 7.8%. Aerospace related companies also outperformed as Boeing (BA +13.75%) rose following a stimulus package which includes $58 billion for the industry. In earnings, Micron Technology (MU +5.39%) rose after giving favorable guidance, benefiting from corporations shifting to a work from home environment. |
 Kenneth J. Gruneisen started out as a licensed stockbroker in August 1987, a couple of months prior to the historic stock market crash that took the Dow Jones Industrial Average down -22.6% in a single day. He has published daily fact-based fundamental and technical analysis on high-ranked stocks online for two decades. Through FACTBASEDINVESTING.COM, Kenneth provides educational articles, news, market commentary, and other information regarding proven investment systems that work in good times and bad.
Comments contained in the body of this report are technical opinions only and are not necessarily those of Gruneisen Growth Corp. The material herein has been obtained from sources believed to be reliable and accurate, however, its accuracy and completeness cannot be guaranteed. Our firm, employees, and customers may effect transactions, including transactions contrary to any recommendation herein, or have positions in the securities mentioned herein or options with respect thereto. Any recommendation contained in this report may not be suitable for all investors and it is not to be deemed an offer or solicitation on our part with respect to the purchase or sale of any securities. |
|
 |
Financial, Retail, Tech, and Energy-Linked Groups Rose
Kenneth J. Gruneisen - Passed the CAN SLIM® Master's Exam
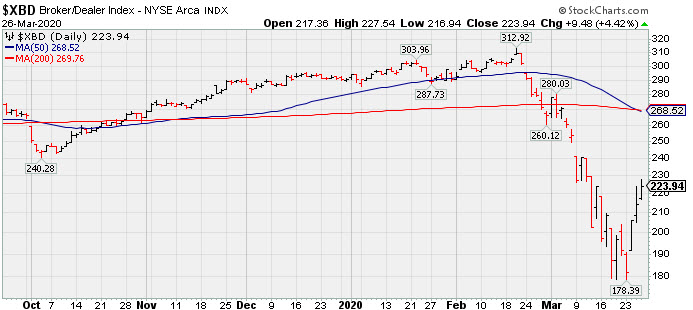
The Bank Index ($BKX +8.06%) and Broker/Dealer Index ($XBD +4.42%) both posted solid gains. The tech sector was unanimously positive as the Semiconductor Index ($SOX +6.79%), Networking Index ($NWX +6.45%) and the Biotech Index ($BTK +5.24%) each posted big gains. The Oil Services Index ($OSX +3.21%) and the Integrated Oil Index ($XOI +5.01%) rose, meanwhile the Gold & Silver Index ($XAU -0.77%) edged lower.
PICTURED: The Broker/Dealer Index ($XBD +4.42%) notched a 3rd consecutive gain.
| Oil Services |
$OSX |
26.81 |
+0.83 |
+3.19% |
-65.76% |
| Integrated Oil |
$XOI |
631.54 |
+30.16 |
+5.01% |
-50.29% |
| Semiconductor |
$SOX |
1,572.61 |
+100.04 |
+6.79% |
-14.98% |
| Networking |
$NWX |
475.67 |
+28.82 |
+6.45% |
-18.47% |
| Broker/Dealer |
$XBD |
223.94 |
+9.48 |
+4.42% |
-22.88% |
| Retail |
$RLX |
2,225.26 |
+95.54 |
+4.49% |
-9.15% |
| Gold & Silver |
$XAU |
88.15 |
-0.68 |
-0.77% |
-17.56% |
| Bank |
$BKX |
69.84 |
+5.21 |
+8.06% |
-38.39% |
| Biotech |
$BTK |
4,437.83 |
+221.02 |
+5.24% |
-12.42% |
|
|
|
 |
No Featured Stocks
Kenneth J. Gruneisen - Passed the CAN SLIM® Master's Exam
During extremely bearish markets the number of stocks covered in this area has sometimes been reduced to zero. We suggest making no excuses for weak stocks in weak markets. Feel free to contact us if you have a need for any additional information. |
|
|
Color Codes Explained :
Y - Better candidates highlighted by our
staff of experts.
G - Previously featured
in past reports as yellow but may no longer be buyable under the
guidelines.
***Last / Change / Volume data in this table is the closing quote data***
|
|
|
THESE ARE NOT BUY RECOMMENDATIONS!
Comments contained in the body of this report are technical
opinions only. The material herein has been obtained
from sources believed to be reliable and accurate, however,
its accuracy and completeness cannot be guaranteed.
This site is not an investment advisor, hence it does
not endorse or recommend any securities or other investments.
Any recommendation contained in this report may not
be suitable for all investors and it is not to be deemed
an offer or solicitation on our part with respect to
the purchase or sale of any securities. All trademarks,
service marks and trade names appearing in this report
are the property of their respective owners, and are
likewise used for identification purposes only.
This report is a service available
only to active Paid Premium Members.
You may opt-out of receiving report notifications
at any time. Questions or comments may be submitted
by writing to Premium Membership Services 665 S.E. 10 Street, Suite 201 Deerfield Beach, FL 33441-5634 or by calling 1-800-965-8307
or 954-785-1121.
|
|
|