You are not logged in.
This means you
CAN ONLY VIEW reports that were published prior to Saturday, February 24, 2024.
You
MUST UPGRADE YOUR MEMBERSHIP if you want to see any current reports.
AFTER MARKET UPDATE - WEDNESDAY, MARCH 25TH, 2020
Previous After Market Report Next After Market Report >>>
|
|
|
|
DOW |
+495.64 |
21,200.55 |
+2.39% |
|
Volume |
1,813,003,721 |
+7% |
|
Volume |
4,662,340,700 |
+7% |
|
NASDAQ |
-33.56 |
7,384.30 |
-0.45% |
|
Advancers |
2,327 |
80% |
|
Advancers |
2,179 |
66% |
|
S&P 500 |
+28.23 |
2,475.56 |
+1.15% |
|
Decliners |
573 |
20% |
|
Decliners |
1,121 |
34% |
|
Russell 2000 |
+13.79 |
1,110.34 |
+1.26% |
|
52 Wk Highs |
3 |
|
|
52 Wk Highs |
5 |
|
|
S&P 600 |
+6.08 |
655.40 |
+0.94% |
|
52 Wk Lows |
54 |
|
|
52 Wk Lows |
72 |
|
|
During market corrections it is especially important to reduce exposure, preserve your capital, and just be patient. Be safe! Historic studies have shown that the biggest up sessions have occurred during market corrections and bear markets.
Disciplined investors know to wait until a new confirmed rally marked by a solid follow-through day. The bold portion of the daily market commentary will note when that happens. For any clarification or additional help applying the fact-based investment system, we invite members to call, or contact us via the inquiry form.
|
 |
Major Indices Finished Mixed as New Leadership Remained Elusive
Kenneth J. Gruneisen - Passed the CAN SLIM® Master's Exam
The Dow advanced 495 points, while the S&P 500 added 1.2%, with both benchmarks notching back-to-back gains for the first time since February. The Nasdaq Composite slipped 0.5%. Breadth was positive as advancers led decliners by a 4-1 margin on the NYSE and nearly 2-1 on the Nasdaq exchange. The reported volume totals were higher than the prior session totals on the NYSE and on the Nasdaq exchange. Leadership remained elusive as zero high-ranked companies from the Leaders List hit a new 52-week high and were listed on the BreakOuts Page. New 52-week lows totals contracted yet still easily outnumbered new 52-week highs totals which were in the single digits on both the NYSE and on the Nasdaq exchange. The major indices' (M criteria) have been in a noted "market correction" and investors have been prompted since February 25th to reduce market exposure. Charts used courtesy of www.stockcharts.com
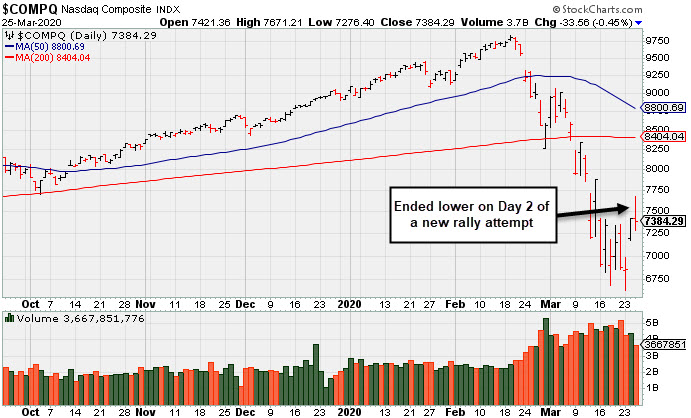
PICTURED: The Nasdaq Composite Index edged lower on Day 2 of a new rally attempt. Disciplined investors know to watch between Days 4-7 for a follow-through day of big gains from the major indices on higher volume coupled with an increase in the number of stocks hitting new highs to confirm a new market uptrend before initiating any new buying efforts.
Stocks finished mixed on Wednesday. Sentiment was buoyed for most of the session on news that White House officials and congressional leaders negotiated an unprecedented stimulus package worth roughly $2 trillion. However, equity gains were pared late in the day following reports of a disagreement between Democratic Senator Bernie Sanders and four congressional Republicans that could stall the latest COVID-19 stimulus bill.
Eight of 11 S&P 500 sectors closed in positive territory, with Communication Services lagging. Industrials outperformed, with Boeing (BA +24.32%) surging on reports that production could resume on its 737-MAX jets by May. In earnings, Nike (NKE +9.24%) after delivering positive quarterly figures and conveying that its business in China has rebounded in the aftermath of the coronavirus outbreak there.
In central bank news, former Fed Chair Ben Bernanke forecasted a “fairly quick rebound” to the U.S. economy if damage to businesses and the workforce was limited, while also applauding the Fed’s quick intervention. Treasuries were little changed, with the yield on the 10-year note up one basis point to 0.84%.
In commodities, WTI crude delivered its third-straight advance, while COMEX gold finished lower, snapping a two-day streak of robust gains.
On the data front, durable goods orders posted a surprise increase in February. Additionally, MBA mortgage applications fell the most since 2009, down 29.4% in the most recent week, pressured by COVID-19 shutdowns and increasing borrowing costs. |
 Kenneth J. Gruneisen started out as a licensed stockbroker in August 1987, a couple of months prior to the historic stock market crash that took the Dow Jones Industrial Average down -22.6% in a single day. He has published daily fact-based fundamental and technical analysis on high-ranked stocks online for two decades. Through FACTBASEDINVESTING.COM, Kenneth provides educational articles, news, market commentary, and other information regarding proven investment systems that work in good times and bad.
Comments contained in the body of this report are technical opinions only and are not necessarily those of Gruneisen Growth Corp. The material herein has been obtained from sources believed to be reliable and accurate, however, its accuracy and completeness cannot be guaranteed. Our firm, employees, and customers may effect transactions, including transactions contrary to any recommendation herein, or have positions in the securities mentioned herein or options with respect thereto. Any recommendation contained in this report may not be suitable for all investors and it is not to be deemed an offer or solicitation on our part with respect to the purchase or sale of any securities. |
|
 |
Financial, Networking, and Commodity-Linked Groups Rose
Kenneth J. Gruneisen - Passed the CAN SLIM® Master's Exam
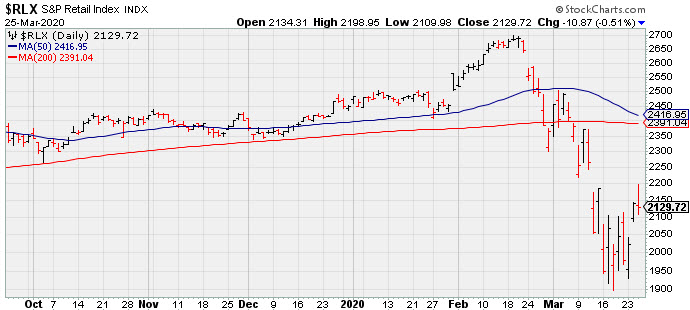
The Bank Index ($BKX +2.24%) and Broker/Dealer Index ($XBD +4.00%) both posted gains. The tech sector was less decisive as the Semiconductor Index ($SOX -1.29%) fell while the Networking Index ($NWX +1.99%) and the Biotech Index ($BTK +0.86%) posted gains. The Oil Services Index ($OSX -3.12%) pulled back following a big +18.37% gain on the prior session, however, the Integrated Oil Index ($XOI +6.52%) and Gold & Silver Index ($XAU +2.97%) both posted gains.
PICTURED: The Retail Index ($RLX -0.51%) edged lower.
| Oil Services |
$OSX |
25.98 |
-0.83 |
-3.10% |
-66.82% |
| Integrated Oil |
$XOI |
601.38 |
+36.80 |
+6.52% |
-52.67% |
| Semiconductor |
$SOX |
1,472.57 |
-19.26 |
-1.29% |
-20.39% |
| Networking |
$NWX |
446.85 |
+8.71 |
+1.99% |
-23.41% |
| Broker/Dealer |
$XBD |
214.45 |
+8.25 |
+4.00% |
-26.15% |
| Retail |
$RLX |
2,129.72 |
-10.87 |
-0.51% |
-13.05% |
| Gold & Silver |
$XAU |
88.83 |
+2.56 |
+2.97% |
-16.92% |
| Bank |
$BKX |
64.63 |
+1.42 |
+2.25% |
-42.99% |
| Biotech |
$BTK |
4,216.81 |
+35.76 |
+0.86% |
-16.79% |
|
|
|
 |
No Featured Stocks
Kenneth J. Gruneisen - Passed the CAN SLIM® Master's Exam
During extremely bearish markets the number of stocks covered in this area has sometimes been reduced to zero. We suggest making no excuses for weak stocks in weak markets. Feel free to contact us if you have a need for any additional information. |
|
|
Color Codes Explained :
Y - Better candidates highlighted by our
staff of experts.
G - Previously featured
in past reports as yellow but may no longer be buyable under the
guidelines.
***Last / Change / Volume data in this table is the closing quote data***
|
|
|
THESE ARE NOT BUY RECOMMENDATIONS!
Comments contained in the body of this report are technical
opinions only. The material herein has been obtained
from sources believed to be reliable and accurate, however,
its accuracy and completeness cannot be guaranteed.
This site is not an investment advisor, hence it does
not endorse or recommend any securities or other investments.
Any recommendation contained in this report may not
be suitable for all investors and it is not to be deemed
an offer or solicitation on our part with respect to
the purchase or sale of any securities. All trademarks,
service marks and trade names appearing in this report
are the property of their respective owners, and are
likewise used for identification purposes only.
This report is a service available
only to active Paid Premium Members.
You may opt-out of receiving report notifications
at any time. Questions or comments may be submitted
by writing to Premium Membership Services 665 S.E. 10 Street, Suite 201 Deerfield Beach, FL 33441-5634 or by calling 1-800-965-8307
or 954-785-1121.
|
|
|