You are not logged in.
This means you
CAN ONLY VIEW reports that were published prior to Monday, February 19, 2024.
You
MUST UPGRADE YOUR MEMBERSHIP if you want to see any current reports.
AFTER MARKET UPDATE - TUESDAY, MARCH 22ND, 2022
Previous After Market Report Next After Market Report >>>
|
|
|
|
DOW |
+254.47 |
34,807.46 |
+0.74% |
|
Volume |
1,069,293,922 |
-3% |
|
Volume |
5,365,407,800 |
-4% |
|
NASDAQ |
+270.36 |
14,108.82 |
+1.95% |
|
Advancers |
1,946 |
61% |
|
Advancers |
3,062 |
69% |
|
S&P 500 |
+50.43 |
4,511.61 |
+1.13% |
|
Decliners |
1,237 |
39% |
|
Decliners |
1,379 |
31% |
|
Russell 2000 |
+22.41 |
2,088.34 |
+1.08% |
|
52 Wk Highs |
82 |
|
|
52 Wk Highs |
82 |
|
|
S&P 600 |
+6.59 |
1,336.36 |
+0.50% |
|
52 Wk Lows |
74 |
|
|
52 Wk Lows |
130 |
|
|
Solid gains from all major market averages came with higher volume coupled with an increase in stocks hitting new 52-week highs last Wednesday - bullish action noted as a late follow-through day confirming a new uptrend (M criteria). Followers of the fact-based investment system know any new buying efforts may be justified only in stocks fitting all key fundamental and technical investment criteria.
|
 |
Major Indices Rose With Less Volume Conviction
Kenneth J. Gruneisen - Passed the CAN SLIM® Master's Exam
The Dow added 254 points, while the S&P 500 gained 1.1%, with both benchmarks back within 6% of their most recent records notched in early January. The Nasdaq Composite jumped nearly 2%. Volume totals reported were lighter than the prior session on the NYSE and on the Nasdaq exchange, indicating less institutional buying conviction. Breadth was positive as advancers led decliners by a 3-2 margin on the NYSE and more than 2-1 on the Nasdaq exchange. There were 35 high-ranked companies from the Leaders List that hit new 52-week highs and were listed on the BreakOuts Page, up from the total of 43 on the prior session. New 52-week highs outnumbered new 52-week lows on the NYSE but 52-week lows still outnumbered new 52-week highs totals on the Nasdaq exchange. The recently noted follow-through day confirmed a new uptrend (M criteria).
Chart courtesy of www.stockcharts.com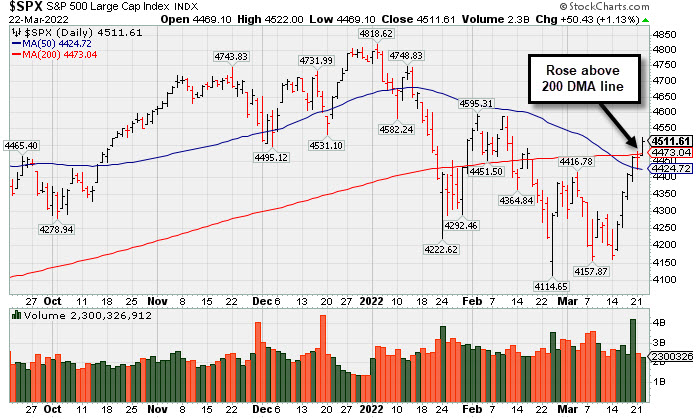 PICTURED: The S&P 500 Index posted a gain with light volume while rebounding above its 200-day moving average (DMA) line.
U.S. stocks finished higher on Tuesday, while a rotation out of bonds persisted as Wall Street mulled recent hawkish remarks from Federal (Fed) Reserve Chair Jerome Powell. A rout in Treasuries continued, with the yield on the 10-year note up eight basis points (0.08%) to 2.38%, its highest level since May 2019. On Monday, Powell said there may be a need for policymakers to move “expeditiously” towards a more neutral level of interest rates to combat elevated inflation.
Ten of 11 S&P 500 sectors closed in positive territory, with growth-related groups leading the advance. Tesla Inc. climbed 7.9%, propelling its market value back above $1 trillion as the electric vehicle maker officially opened its German production factory. Additionally, banks were among the standouts, helped by the jump in Treasury yields and positive analyst commentary. Earnings from Nike Inc. (NKE +2.23%) also offered a bright spot following robust results that included commentary around normalizing supply chains. In other corporate news, Alibaba Group Holdings Ltd. (BABA +11.00%) rose after boosting its stock buyback plan.
In commodities, West Texas Intermediate crude dipped 0.3% to $111.76/barrel as some European Union members, including Germany, indicated they remain too dependent on energy from Russia to implement sanctions. On the economic data front, an update from the Richmond Fed showed manufacturing activity in the region improved more than anticipated in March.
|
 Kenneth J. Gruneisen started out as a licensed stockbroker in August 1987, a couple of months prior to the historic stock market crash that took the Dow Jones Industrial Average down -22.6% in a single day. He has published daily fact-based fundamental and technical analysis on high-ranked stocks online for two decades. Through FACTBASEDINVESTING.COM, Kenneth provides educational articles, news, market commentary, and other information regarding proven investment systems that work in good times and bad.
Comments contained in the body of this report are technical opinions only and are not necessarily those of Gruneisen Growth Corp. The material herein has been obtained from sources believed to be reliable and accurate, however, its accuracy and completeness cannot be guaranteed. Our firm, employees, and customers may effect transactions, including transactions contrary to any recommendation herein, or have positions in the securities mentioned herein or options with respect thereto. Any recommendation contained in this report may not be suitable for all investors and it is not to be deemed an offer or solicitation on our part with respect to the purchase or sale of any securities. |
|
 |
Financial, Retail, and Tech Indices Rose
Kenneth J. Gruneisen - Passed the CAN SLIM® Master's Exam
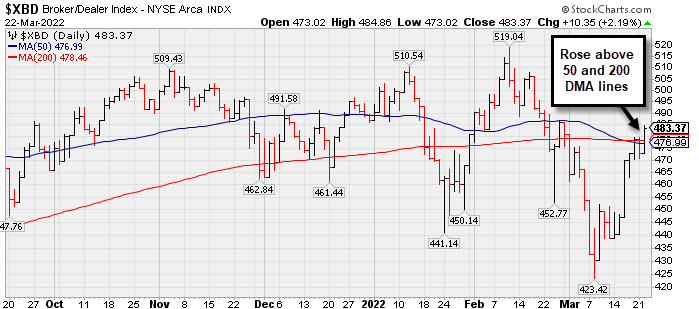
Financials had a positive influence on the major averages as the Bank Index ($BKX +2.27%) and Broker/Dealer Index ($XBD +2.19%) both outpaced the Retail Index ($RLX +1.32%). The Biotech Index ($BTK +1.88%) led then tech sector higher while the Semiconductor Index ($SOX +0.66%) and Networking Index ($NWX +1.00%) also posted gains. Meanwhile, commodity-linked groups had a negative bias as the Gold & Silver Index ($XAU -1.07%) outpaced the Oil Services Index ($OSX -0.68%) and Integrated Oil Index ($XOI -0.94%) to the downside. PICTURED: The Broker/Dealer Index ($XBD +2.19%) rebounded above its 50-day and 200-day moving average (DMA) lines since slumping to new 2022 lows in early March.
| Oil Services |
$OSX |
77.55 |
-0.53 |
-0.68% |
+47.11% |
| Integrated Oil |
$XOI |
1,546.75 |
-14.66 |
-0.94% |
+31.28% |
| Semiconductor |
$SOX |
3,445.85 |
+22.62 |
+0.66% |
-12.68% |
| Networking |
$NWX |
889.71 |
+8.77 |
+1.00% |
-8.38% |
| Broker/Dealer |
$XBD |
483.37 |
+10.35 |
+2.19% |
-0.72% |
| Retail |
$RLX |
3,922.57 |
+50.93 |
+1.32% |
-7.19% |
| Gold & Silver |
$XAU |
157.44 |
-1.71 |
-1.07% |
+18.87% |
| Bank |
$BKX |
132.22 |
+2.94 |
+2.27% |
+0.00% |
| Biotech |
$BTK |
5,138.01 |
+94.81 |
+1.88% |
-6.89% |
|
|
|
 |
|
|
|
Color Codes Explained :
Y - Better candidates highlighted by our
staff of experts.
G - Previously featured
in past reports as yellow but may no longer be buyable under the
guidelines.
***Last / Change / Volume data in this table is the closing quote data***
|
|
|
THESE ARE NOT BUY RECOMMENDATIONS!
Comments contained in the body of this report are technical
opinions only. The material herein has been obtained
from sources believed to be reliable and accurate, however,
its accuracy and completeness cannot be guaranteed.
This site is not an investment advisor, hence it does
not endorse or recommend any securities or other investments.
Any recommendation contained in this report may not
be suitable for all investors and it is not to be deemed
an offer or solicitation on our part with respect to
the purchase or sale of any securities. All trademarks,
service marks and trade names appearing in this report
are the property of their respective owners, and are
likewise used for identification purposes only.
This report is a service available
only to active Paid Premium Members.
You may opt-out of receiving report notifications
at any time. Questions or comments may be submitted
by writing to Premium Membership Services 665 S.E. 10 Street, Suite 201 Deerfield Beach, FL 33441-5634 or by calling 1-800-965-8307
or 954-785-1121.
|
|
|