***Last / Change / Volume data in this table is the closing quote data***
Symbol/Exchange
Company Name
Industry Group |
PRICE |
CHANGE
(%Change) |
Day High |
Volume
(% DAV)
(% 50 day avg vol) |
52 Wk Hi
% From Hi |
Featured
Date |
Price
Featured |
Pivot Featured |
|
Max Buy |
MLR
-
NYSE
Miller Industries Inc
AUTOMOTIVE - Auto Parts
|
$31.07
|
-1.35
-4.16% |
$32.32
|
45,258
141.43% of 50 DAV
50 DAV is 32,000
|
$35.26
-11.88%
|
11/30/2018
|
$28.35
|
PP = $29.50
|
|
MB = $30.98
|
 Most Recent Note - 3/22/2019 12:56:33 PM
G - Undercutting its 50 DMA line ($31.39) with today's loss raising concerns. Prior highs in the $29 area define the next near-term support to watch. Endured mild distributional pressure over the past 2 weeks. Reported earnings +17% on +13% sales revenues for the Dec '18 quarter, below the +25% minimum guideline (C criteria), raising fundamental concerns.
>>> FEATURED STOCK ARTICLE : Extended From Prior Base After Impressive Streak of Gains - 3/1/2019 |
View all notes |
Set NEW NOTE alert |
Company Profile |
SEC
News |
Chart |
Request a new note
C
A
S
I |
NSP
-
NYSE
Insperity Inc
Comml Svcs-Outsourcing
|
$120.50
|
-6.47
-5.10% |
$126.56
|
289,382
81.29% of 50 DAV
50 DAV is 356,000
|
$132.50
-9.06%
|
2/11/2019
|
$127.91
|
PP = $121.25
|
|
MB = $127.31
|
Most Recent Note - 3/22/2019 1:14:31 PM
Y - Pulling back today with light volume amid broader market weakness. Consolidating near prior highs in the $119-121 area which define important near-term support to watch.
>>> FEATURED STOCK ARTICLE : Volume Totals Cooling and Consolidating Near Prior Highs - 3/14/2019 |
View all notes |
Set NEW NOTE alert |
Company Profile |
SEC
News |
Chart |
Request a new note
C
A
S
I |
ZBRA
-
NASDAQ
Zebra Tech Corp Cl A
COMPUTER HARDWARE - Computer Peripherals
|
$207.24
|
-11.06
-5.07% |
$218.75
|
534,496
115.19% of 50 DAV
50 DAV is 464,000
|
$219.39
-5.54%
|
2/14/2019
|
$198.10
|
PP = $184.85
|
|
MB = $194.09
|
Most Recent Note - 3/22/2019 12:47:37 PM
G - Pulling back today, and it is extended from the prior base after wedging higher with recent gains lacking great volume-conviction. Its 50 DMA line ($190) and prior highs in the $184 area define near-term support to watch.
>>> FEATURED STOCK ARTICLE : Big Volume-Driven Gain for New High - 2/14/2019 |
View all notes |
Set NEW NOTE alert |
Company Profile |
SEC
News |
Chart |
Request a new note
C
A
S
I |
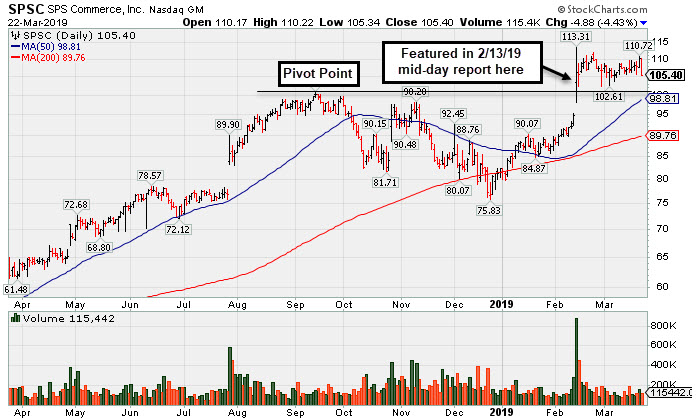
SPSC
-
NASDAQ
S P S Commerce Inc
COMPUTER SOFTWARE and SERVICES - Application Software
|
$105.40
|
-4.88
-4.43% |
$110.22
|
115,442
74.48% of 50 DAV
50 DAV is 155,000
|
$113.31
-6.98%
|
2/13/2019
|
$104.30
|
PP = $100.78
|
|
MB = $105.82
|
Most Recent Note - 3/22/2019 6:49:03 PM
G - Still consolidating in an orderly fashion well above prior highs in the $100 area defining support to watch along with its 50 DMA line ($98.81). See the latest FSU analysis for more details and a new annotated graph.
>>> FEATURED STOCK ARTICLE : Consolidating in Orderly Fashion Above Prior Highs - 3/22/2019 |
View all notes |
Set NEW NOTE alert |
Company Profile |
SEC
News |
Chart |
Request a new note
C
A
S
I |
SSNC
-
NASDAQ
S S & C Technologies
COMPUTER SOFTWARE and SERVICES - Application Software
|
$62.14
|
-1.49
-2.34% |
$63.70
|
1,401,728
78.09% of 50 DAV
50 DAV is 1,795,000
|
$64.36
-3.45%
|
2/15/2019
|
$59.73
|
PP = $61.07
|
|
MB = $64.12
|
Most Recent Note - 3/22/2019 6:50:50 PM
Y - Pulled back from its all-time high with below average volume. Stalled after a 3/01/19 gain above its pivot point backed by +49% above average volume triggered a technical buy signal.
>>> FEATURED STOCK ARTICLE : Volume-Driven Gain for New High Close - 2/19/2019 |
View all notes |
Set NEW NOTE alert |
Company Profile |
SEC
News |
Chart |
Request a new note
C
A
S
I |
Symbol/Exchange
Company Name
Industry Group |
PRICE |
CHANGE
(%Change) |
Day High |
Volume
(% DAV)
(% 50 day avg vol) |
52 Wk Hi
% From Hi |
Featured
Date |
Price
Featured |
Pivot Featured |
|
Max Buy |
IRBT
-
NASDAQ
Irobot Corp
CONSUMER DURABLES - Electronic Equipment
|
$119.25
|
-6.30
-5.02% |
$125.29
|
566,965
68.31% of 50 DAV
50 DAV is 830,000
|
$132.88
-10.26%
|
2/8/2019
|
$104.92
|
PP = $103.63
|
|
MB = $108.81
|
Most Recent Note - 3/22/2019 12:59:52 PM
G - Pulling back today with light volume amid broader market weakness. Consolidating near its August '18 high, possibly forming a new base. Recent gains have lacked great volume conviction. It is extended from the previously noted "double bottom" base.
>>> FEATURED STOCK ARTICLE : Consolidating After Getting Extended from Double Bottom Base - 3/12/2019 |
View all notes |
Set NEW NOTE alert |
Company Profile |
SEC
News |
Chart |
Request a new note
C
A
S
I |
AUDC
-
NASDAQ
Audiocodes Ltd
ELECTRONICS - Scientific and Technical Instrum
|
$13.04
|
-0.84
-6.05% |
$13.83
|
276,157
107.45% of 50 DAV
50 DAV is 257,000
|
$14.96
-12.83%
|
3/20/2019
|
$13.66
|
PP = $15.06
|
|
MB = $15.81
|
Most Recent Note - 3/22/2019 12:52:11 PM
G - Color code is changed to green while slumping below its 50 DMA line ($13.33) with today's big volume-driven loss raising concerns. Prior lows in the $12.50 area define the next important near-term support. A rebound above the 50 DMA line is needed for its outlook to improve. Highlighted in yellow with pivot point cited based on its 1/28/19 high plus 10 cents in the 3/20/19 mid-day report and noted - "Subsequent gains above the pivot point backed by at least +40% above average volume are needed to trigger a new technical buy signal. This Israel-based Telecom firm found support near prior highs and near its 50 DMA line during an orderly 7-week consolidation. Reported earnings +67% on +11% sales revenues for the Dec '18 quarter. its 8th consecutive quarterly comparison above the +25% minimum guideline (C criteria)."
>>> FEATURED STOCK ARTICLE : Building a Base and Found Support Near 50-Day Moving Average - 3/20/2019 |
View all notes |
Set NEW NOTE alert |
Company Profile |
SEC
News |
Chart |
Request a new note
C
A
S
I |
ENV
-
NYSE
Envestnet Inc
FINANCIAL SERVICES - Diversified Investments
|
$64.10
|
-2.29
-3.45% |
$66.00
|
333,497
121.71% of 50 DAV
50 DAV is 274,000
|
$67.52
-5.07%
|
3/15/2019
|
$66.05
|
PP = $64.90
|
|
MB = $68.15
|
Most Recent Note - 3/21/2019 5:26:10 PM
Y - Posted a gain today with average volume, trading near its all-time high. Finished strong after highlighted in yellow with pivot point cited based on its 9/14/18 high plus 10 cents in the 3/15/19 mid-day report.
>>> FEATURED STOCK ARTICLE : Volume Heavy Behind Rally to New Highs - 3/15/2019 |
View all notes |
Set NEW NOTE alert |
Company Profile |
SEC
News |
Chart |
Request a new note
C
A
S
I |
LHCG
-
NASDAQ
L H C Group Inc
HEALTH SERVICES - Home Health Care
|
$111.18
|
-2.61
-2.29% |
$115.54
|
220,035
84.63% of 50 DAV
50 DAV is 260,000
|
$114.37
-2.79%
|
1/23/2019
|
$107.29
|
PP = $107.61
|
|
MB = $112.99
|
Most Recent Note - 3/22/2019 6:56:14 PM
Y - There was a "negative reversal" today after hitting a new all-time high. Recently found support at its 50 DMA line and formed a base-on-base. Bullish action came after it reported earnings +66% on +75% sales revenues for the Dec '18 quarter.
>>> FEATURED STOCK ARTICLE : Recent Gains for New Highs Lacked Great Volume Conviction - 2/21/2019 |
View all notes |
Set NEW NOTE alert |
Company Profile |
SEC
News |
Chart |
Request a new note
C
A
S
I |
ENSG
-
NASDAQ
Ensign Group Inc
HEALTH SERVICES - Long-Term Care Facilities
|
$49.13
|
-1.54
-3.04% |
$50.64
|
193,495
59.54% of 50 DAV
50 DAV is 325,000
|
$54.56
-9.95%
|
2/7/2019
|
$48.71
|
PP = $49.06
|
|
MB = $51.51
|
Most Recent Note - 3/22/2019 6:54:53 PM
Y - Recently consolidating above prior highs in the $48 area, and above its 50 DMA line ($47.26) defining the next important near-term support level to watch.
>>> FEATURED STOCK ARTICLE : Consolidating Near Proir High and Above 50-Day Average - 3/11/2019 |
View all notes |
Set NEW NOTE alert |
Company Profile |
SEC
News |
Chart |
Request a new note
C
A
S
I |
Symbol/Exchange
Company Name
Industry Group |
PRICE |
CHANGE
(%Change) |
Day High |
Volume
(% DAV)
(% 50 day avg vol) |
52 Wk Hi
% From Hi |
Featured
Date |
Price
Featured |
Pivot Featured |
|
Max Buy |
NXST
-
NASDAQ
Nexstar Media Group Cl A
MEDIA - Broadcasting - TV
|
$105.20
|
-3.45
-3.18% |
$108.49
|
546,802
105.76% of 50 DAV
50 DAV is 517,000
|
$109.55
-3.97%
|
2/26/2019
|
$94.26
|
PP = $89.76
|
|
MB = $94.25
|
Most Recent Note - 3/21/2019 5:27:32 PM
G - Posted a solid gain today with above average volume hitting a new all-time high. Disciplined investors avoid chasing stocks more than +5% above the prior high.
>>> FEATURED STOCK ARTICLE : Twice Average Volume Behind Gain for New High - 2/26/2019 |
View all notes |
Set NEW NOTE alert |
Company Profile |
SEC
News |
Chart |
Request a new note
C
A
S
I |
BSTC
-
NASDAQ
Biospecifics Technologie
Medical-Biomed/Biotech
|
$65.01
|
-2.77
-4.09% |
$67.53
|
42,647
94.77% of 50 DAV
50 DAV is 45,000
|
$73.31
-11.32%
|
1/18/2019
|
$67.40
|
PP = $66.31
|
|
MB = $69.63
|
Most Recent Note - 3/21/2019 12:23:54 PM
Y - Due to report earnings news, and volume and volatility often increase near earnings news. Consolidating near prior highs and near its 50 DMA line ($66.93) defining important near-term support to watch. More damaging losses would raise concerns and trigger a technical sell signal.
>>> FEATURED STOCK ARTICLE : Consolidating Above 50-Day Moving Average and Prior Highs - 3/7/2019 |
View all notes |
Set NEW NOTE alert |
Company Profile |
SEC
News |
Chart |
Request a new note
C
A
S
I |
ULTA
-
NASDAQ
Ulta Beauty Inc
SPECIALTY RETAIL - Specialty Retail, Other
|
$330.52
|
-4.61
-1.38% |
$336.07
|
694,854
86.42% of 50 DAV
50 DAV is 804,000
|
$345.24
-4.26%
|
3/15/2019
|
$341.27
|
PP = $322.59
|
|
MB = $338.72
|
Most Recent Note - 3/22/2019 6:52:32 PM
Y - Pulled back from its all-time high with a loss today on light volume. A big "breakaway gap" on 3/15/19 backed by heavy volume triggered a technical buy signal. Bullish action came after it reported earnings +31% sales revenues on +10% sales revenues for the Jan '19 quarter.
>>> FEATURED STOCK ARTICLE : Consolidating Following Big "Breakaway Gap" - 3/19/2019 |
View all notes |
Set NEW NOTE alert |
Company Profile |
SEC
News |
Chart |
Request a new note
C
A
S
I |
UBNT
-
NASDAQ
Ubiquiti Networks
TELECOMMUNICATIONS - Diversified Communication Serv
|
$144.27
|
-3.06
-2.08% |
$147.30
|
265,184
74.49% of 50 DAV
50 DAV is 356,000
|
$148.68
-2.97%
|
2/8/2019
|
$121.97
|
PP = $115.54
|
|
MB = $121.32
|
Most Recent Note - 3/22/2019 6:51:44 PM
G - Still perched near its all-time high with volume totals cooling, very extended from the prior base. Fundamentals remain strong. Prior high ($115) defines initial support to watch on pullbacks.
>>> FEATURED STOCK ARTICLE : Bullish Action Came Following Another Strong Earnings Report - 3/5/2019 |
View all notes |
Set NEW NOTE alert |
Company Profile |
SEC
News |
Chart |
Request a new note
C
A
S
I |
ESNT
-
NYSE
Essent Group Ltd
Finance-MrtgandRel Svc
|
$43.83
|
-2.01
-4.38% |
$45.50
|
1,268,546
218.34% of 50 DAV
50 DAV is 581,000
|
$47.94
-8.57%
|
3/18/2019
|
$45.84
|
PP = $45.06
|
|
MB = $47.31
|
Most Recent Note - 3/22/2019 12:28:30 PM
Y - Today's 3rd big volume-driven loss in the span of 4 sessions has it slumping below its pivot point and back into the prior base, raising concerns. Following a big volume-driven breakout gain on 3/18/19 it was repeatedly noted - "Faces some resistance due to overhead supply up to the $50 level. Reported earnings +66% on +20% sales revenues for the Dec '18 quarter, its 4th consecutive comparison above the +25% minimum earnings guideline (C criteria)."
>>> FEATURED STOCK ARTICLE : Big Breakout Gain With +350% Above Average Volume - 3/18/2019 |
View all notes |
Set NEW NOTE alert |
Company Profile |
SEC
News |
Chart |
Request a new note
C
A
S
I |
Symbol/Exchange
Company Name
Industry Group |
PRICE |
CHANGE
(%Change) |
Day High |
Volume
(% DAV)
(% 50 day avg vol) |
52 Wk Hi
% From Hi |
Featured
Date |
Price
Featured |
Pivot Featured |
|
Max Buy |
NOW
-
NYSE
Servicenow Inc
Computer Sftwr-Enterprse
|
$241.21
|
-9.74
-3.88% |
$250.50
|
1,998,249
94.08% of 50 DAV
50 DAV is 2,124,000
|
$251.65
-4.15%
|
1/31/2019
|
$218.14
|
PP = $206.40
|
|
MB = $216.72
|
Most Recent Note - 3/20/2019 6:08:55 PM
G - Posted a quiet gain today for another new all-time high. Extended from any sound base. Its 50 DMA line ($219.72) defines near-term support above the prior high ($206).
>>> FEATURED STOCK ARTICLE : Pulling Back After 6 Straight Weekly Gains - 3/6/2019 |
View all notes |
Set NEW NOTE alert |
Company Profile |
SEC
News |
Chart |
Request a new note
C
A
S
I |
PANW
-
NYSE
Palo Alto Networks
Computer Sftwr-Security
|
$242.36
|
-7.43
-2.97% |
$250.09
|
1,027,864
71.78% of 50 DAV
50 DAV is 1,432,000
|
$260.63
-7.01%
|
2/25/2019
|
$233.54
|
PP = $239.60
|
|
MB = $251.58
|
Most Recent Note - 3/22/2019 6:58:17 PM
Y - Pulled back today with lighter than average volume, slumping near its pivot point. The prior low and its 50 DMA line define additional near-term support to watch. Reported earnings +44% on +30% sales revenues for the Jan '19 quarter, continuing its strong earnings track record.
>>> FEATURED STOCK ARTICLE : Rebounded Near Prior High With Earnings News Due - 2/25/2019 |
View all notes |
Set NEW NOTE alert |
Company Profile |
SEC
News |
Chart |
Request a new note
C
A
S
I |
ANET
-
NYSE
Arista Networks Inc
TELECOMMUNICATIONS - Communication Equipment
|
$300.16
|
-14.86
-4.72% |
$314.90
|
1,134,299
129.34% of 50 DAV
50 DAV is 877,000
|
$316.67
-5.21%
|
3/13/2019
|
$295.38
|
PP = $313.37
|
|
MB = $329.04
|
Most Recent Note - 3/22/2019 1:12:41 PM
Y - Pulling back abruptly today amid broader market weakness. Hit a new all-time high on the prior session with a solid gain above the pivot point backed by +90% above average volume triggering a technical buy signal.
>>> FEATURED STOCK ARTICLE : Rebounding Near High After Deep Consolidation - 3/13/2019 |
View all notes |
Set NEW NOTE alert |
Company Profile |
SEC
News |
Chart |
Request a new note
C
A
S
I |
PAYC
-
NYSE
Paycom Software Inc
COMPUTER SOFTWARE and SERVICES - Application Software
|
$181.16
|
-8.89
-4.68% |
$190.63
|
747,673
114.85% of 50 DAV
50 DAV is 651,000
|
$190.64
-4.97%
|
2/6/2019
|
$171.66
|
PP = $164.18
|
|
MB = $172.39
|
Most Recent Note - 3/22/2019 1:15:48 PM
G - Pulling back abruptly today after hitting another new all-time with a big gain on the prior session. It did not form a sound new base of sufficient length but stubbornly held its ground. Its 50 DMA line and prior high coincide defining important near-term support to watch in the $164 area.
>>> FEATURED STOCK ARTICLE : Consolidating Near All-Time High - 3/8/2019 |
View all notes |
Set NEW NOTE alert |
Company Profile |
SEC
News |
Chart |
Request a new note
C
A
S
I |
PYPL
-
NASDAQ
Paypal Holdings Inc
Finance-CrdtCard/PmtPr
|
$101.27
|
-2.88
-2.77% |
$104.00
|
7,193,267
93.44% of 50 DAV
50 DAV is 7,698,000
|
$104.56
-3.15%
|
1/24/2019
|
$92.56
|
PP = $93.80
|
|
MB = $98.49
|
Most Recent Note - 3/20/2019 6:16:14 PM
G - Posted another gain today with lighter than average volume for a new high, getting more extended from any sound base. Its 50 DMA line and prior highs in the $94 area define important near-term support to watch on pullbacks.
>>> FEATURED STOCK ARTICLE : Wedging into New High Territory With Gains Lacking Volume - 2/22/2019 |
View all notes |
Set NEW NOTE alert |
Company Profile |
SEC
News |
Chart |
Request a new note
C
A
S
I |
Symbol/Exchange
Company Name
Industry Group |
PRICE |
CHANGE
(%Change) |
Day High |
Volume
(% DAV)
(% 50 day avg vol) |
52 Wk Hi
% From Hi |
Featured
Date |
Price
Featured |
Pivot Featured |
|
Max Buy |
ALRM
-
NASDAQ
Alarm.com Holdings Inc
Security/Sfty
|
$61.09
|
-1.94
-3.08% |
$63.09
|
289,186
52.20% of 50 DAV
50 DAV is 554,000
|
$65.85
-7.23%
|
1/22/2019
|
$60.52
|
PP = $60.30
|
|
MB = $63.32
|
Most Recent Note - 3/22/2019 6:53:44 PM
G - Slumped below its 50 DMA line ($61.44) with today's loss on light volume. Weak action came after it recently reported earnings +12% on +25% sales revenues for the Dec '18 quarter, below the +25% minimum earnings guideline (C criteria), raising fundamental concerns.
>>> FEATURED STOCK ARTICLE : Volume Totals Cooling While Perched at All-Time High - 2/20/2019 |
View all notes |
Set NEW NOTE alert |
Company Profile |
SEC
News |
Chart |
Request a new note
C
A
S
I |
PLNT
-
NYSE
Planet Fitness Inc Cl A
Leisure-Services
|
$66.77
|
-0.88
-1.30% |
$67.74
|
1,135,227
81.97% of 50 DAV
50 DAV is 1,385,000
|
$68.46
-2.47%
|
11/7/2018
|
$57.10
|
PP = $55.45
|
|
MB = $58.22
|
Most Recent Note - 3/20/2019 6:13:54 PM
G - Perched near its all-time high with volume totals cooling after a streak of gains. Its 50 DMA line and prior highs define near-term support in the $59-60 area. Showed bullish after after it recently reported earnings +42% on +30% sales revenues for the Dec '18 quarter.
>>> FEATURED STOCK ARTICLE : Met Distributional Pressure While Hitting New High After Earnings - 2/27/2019 |
View all notes |
Set NEW NOTE alert |
Company Profile |
SEC
News |
Chart |
Request a new note
C
A
S
I |
TEAM
-
NASDAQ
Atlassian Corp Plc Cl A
Comp Sftwr-Spec Enterprs
|
$109.83
|
-5.67
-4.91% |
$115.05
|
1,430,442
84.89% of 50 DAV
50 DAV is 1,685,000
|
$115.88
-5.22%
|
1/7/2019
|
$94.68
|
PP = $98.31
|
|
MB = $103.23
|
Most Recent Note - 3/22/2019 1:06:02 PM
G - Pulling back today after inching into new all-time high territory with gains in recent weeks lacking great volume-conviction. Extended from any sound base, its 50 DMA line ($102.83) and recent low ($99.77 on 3/04/19) define near-term support to watch. Fundamentals remain strong.
>>> FEATURED STOCK ARTICLE : Pullback on Higher Volume After Recent Gains With Less Volume - 3/4/2019 |
View all notes |
Set NEW NOTE alert |
Company Profile |
SEC
News |
Chart |
Request a new note
C
A
S
I |
GLOB
-
NYSE
Globant SA
Computer-Tech Services
|
$69.91
|
-3.08
-4.22% |
$72.62
|
175,020
81.03% of 50 DAV
50 DAV is 216,000
|
$74.00
-5.53%
|
2/15/2019
|
$69.35
|
PP = $70.00
|
|
MB = $73.50
|
Most Recent Note - 3/22/2019 7:00:15 PM
Y - Pulled back from its all-time high with today's loss on below average volume. Its 50 DMA line ($68.28) and prior lows in the $66-67 area define important near-term support to watch where violations would raise concerns and trigger technical sell signals.
>>> FEATURED STOCK ARTICLE : Volume-Driven Gain From Advanced "3-Weeks Tight" Base - 2/15/2019 |
View all notes |
Set NEW NOTE alert |
Company Profile |
SEC
News |
Chart |
Request a new note
C
A
S
I |
TTD
-
NASDAQ
The Trade Desk Inc Cl A
Comml Svcs-Advertising
|
$202.91
|
-10.66
-4.99% |
$214.70
|
1,495,656
106.99% of 50 DAV
50 DAV is 1,398,000
|
$214.48
-5.39%
|
2/6/2019
|
$148.65
|
PP = $149.00
|
|
MB = $156.45
|
Most Recent Note - 3/22/2019 1:08:46 PM
G - Perched at its all-time high, very extended from the prior base. Its 50 DMA line ($166) and prior high ($161) define near-term support to watch. Fundamentals are strong. See the latest FSU analysis for more details and an annotated graph.
>>> FEATURED STOCK ARTICLE : Hit Another New All-Time High Getting Extended From Prior Base - 3/21/2019 |
View all notes |
Set NEW NOTE alert |
Company Profile |
SEC
News |
Chart |
Request a new note
C
A
S
I |
Symbol/Exchange
Company Name
Industry Group |
PRICE |
CHANGE
(%Change) |
Day High |
Volume
(% DAV)
(% 50 day avg vol) |
52 Wk Hi
% From Hi |
Featured
Date |
Price
Featured |
Pivot Featured |
|
Max Buy |