You are not logged in.
This means you
CAN ONLY VIEW reports that were published prior to Tuesday, February 20, 2024.
You
MUST UPGRADE YOUR MEMBERSHIP if you want to see any current reports.
AFTER MARKET UPDATE - MONDAY, MARCH 21ST, 2022
Previous After Market Report Next After Market Report >>>
|
|
|
|
DOW |
-201.94 |
34,552.99 |
-0.58% |
|
Volume |
1,103,147,186 |
-68% |
|
Volume |
5,608,577,300 |
-31% |
|
NASDAQ |
-55.38 |
13,838.46 |
-0.40% |
|
Advancers |
1,279 |
40% |
|
Advancers |
1,758 |
39% |
|
S&P 500 |
-1.94 |
4,461.18 |
-0.04% |
|
Decliners |
1,956 |
60% |
|
Decliners |
2,766 |
61% |
|
Russell 2000 |
-20.21 |
2,065.94 |
-0.97% |
|
52 Wk Highs |
118 |
|
|
52 Wk Highs |
67 |
|
|
S&P 600 |
-8.95 |
1,329.77 |
-0.67% |
|
52 Wk Lows |
61 |
|
|
52 Wk Lows |
126 |
|
|
Solid gains from all major market averages came with higher volume coupled with an increase in stocks hitting new 52-week highs last Wednesday - bullish action noted as a late follow-through day confirming a new uptrend (M criteria). Followers of the fact-based investment system know any new buying efforts may be justified only in stocks fitting all key fundamental and technical investment criteria.
|
 |
Major Averages Sputtered With Lighter Volume Totals
Kenneth J. Gruneisen - Passed the CAN SLIM® Master's Exam
The S&P 500 finished just below the flat line, while the Nasdaq Composite slipped 0.4%, with both indexes snapping a four-day rally which had capped their best weekly performance since November 2020 on Friday. The Dow fell 201 points on the heels of its first weekly advance (+5.5%) in six weeks. Volume totals reported were lighter than the prior session on the NYSE and on the Nasdaq exchange, as Friday's totals were inflated by options expirations. Breadth was negative as decliners led advancers by a 3-2 margin on the NYSE and on the Nasdaq exchange. There were 43 high-ranked companies from the Leaders List that hit new 52-week highs and were listed on the BreakOuts Page, up from the total of 25 on the prior session. New 52-week highs outnumbered new 52-week lows on the NYSE but 52-week lows still outnumbered new 52-week highs totals on the Nasdaq exchange. The recently noted follow-through day confirmed a new uptrend (M criteria).
Chart courtesy of www.stockcharts.com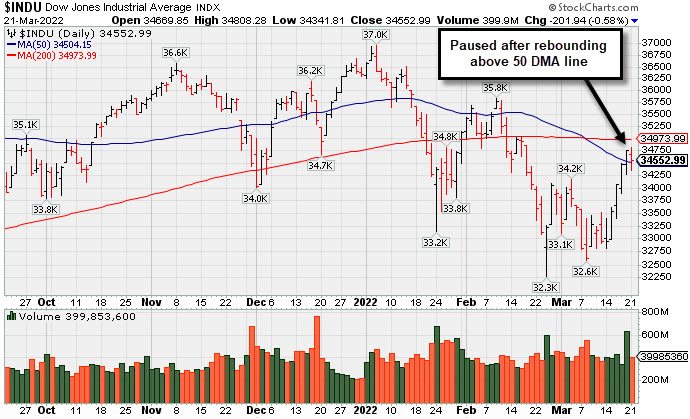 PICTURED: The Dow Jones Industrial Average paused after a streak of 5 straight gains rebounding above its 50-day moving average (DMA) line.
U.S. equities finished lower on Monday, reversing earlier gains following perceived hawkish commentary from Federal Reserve (Fed) Chair Jerome Powell. The Fed chief said policymakers could raise benchmark rates by a more-aggressive 0.50% at future meetings to combat high inflation, if appropriate.
Treasuries resumed their recent sell-off, with the yield curve flattening. The yield on the benchmark 10-year note jumped 14 basis points (0.14%) to 2.30%, while the more Fed-sensitive two-year note yield spiked 18 basis points (0.18%) to 2.12%, with each maturity yield trading near their highest levels since May 2019. In commodities, West Texas Intermediate crude rose 7.4% to $112.47/barrel after the European Union said it would deliberate an oil embargo on Russia as the war in Ukraine extends into a fourth week.
Six of 11 S&P 500 sectors finished in negative territory. The Energy group notably outperformed, jumping 3.8%. In corporate news, Boeing Co. (BA -3.59%) following reports one of its 737 passenger planes operated by China Eastern Airlines crashed in southern China. Elsewhere, Alleghany Corp. (Y +24.80%) rose after agreeing to be acquired by Berkshire Hathaway for $11.6 billion in cash. Nielsen Holdings Plc. (NLSN -6.87%) fell after rejecting a $9.1 billion takeover bid from a consortium of private equity firms.
|
 Kenneth J. Gruneisen started out as a licensed stockbroker in August 1987, a couple of months prior to the historic stock market crash that took the Dow Jones Industrial Average down -22.6% in a single day. He has published daily fact-based fundamental and technical analysis on high-ranked stocks online for two decades. Through FACTBASEDINVESTING.COM, Kenneth provides educational articles, news, market commentary, and other information regarding proven investment systems that work in good times and bad.
Comments contained in the body of this report are technical opinions only and are not necessarily those of Gruneisen Growth Corp. The material herein has been obtained from sources believed to be reliable and accurate, however, its accuracy and completeness cannot be guaranteed. Our firm, employees, and customers may effect transactions, including transactions contrary to any recommendation herein, or have positions in the securities mentioned herein or options with respect thereto. Any recommendation contained in this report may not be suitable for all investors and it is not to be deemed an offer or solicitation on our part with respect to the purchase or sale of any securities. |
|
 |
Commodity-Linked Groups Rose While Financial, Retail, and Tech Fell
Kenneth J. Gruneisen - Passed the CAN SLIM® Master's Exam
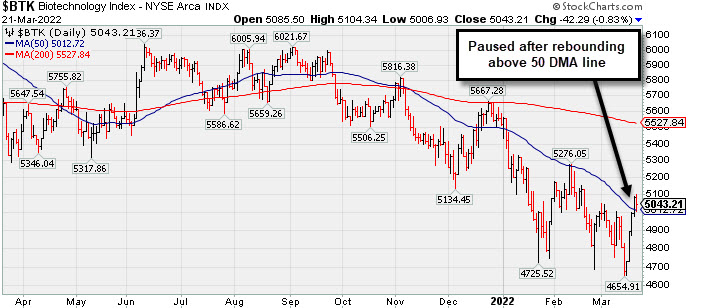
Commodity-linked groups had a positive bias as the Gold & Silver Index ($XAU +2.15%), Oil Services Index ($OSX +3.04%), and Integrated Oil Index ($XOI +4.15%) each posted a solid gain. Meanwhile, the Broker/Dealer Index ($XBD -1.20%), Bank Index ($BKX -0.52%), and Retail Index ($RLX -0.95%) each lost ground. The Biotech Index ($BTK -0.83%) led the tech sector lower while the Semiconductor Index ($SOX -0.26%) and Networking Index ($NWX -0.37%) both suffered smaller losses. PICTURED: The Biotech Index ($BTK -0.83%) paused after rebounding above its 50-day moving average (DMA) line since slumping to new 2022 lows.
| Oil Services |
$OSX |
78.09 |
+2.31 |
+3.04% |
+48.12% |
| Integrated Oil |
$XOI |
1,561.41 |
+62.18 |
+4.15% |
+32.52% |
| Semiconductor |
$SOX |
3,423.24 |
-9.06 |
-0.26% |
-13.25% |
| Networking |
$NWX |
880.94 |
-3.24 |
-0.37% |
-9.28% |
| Broker/Dealer |
$XBD |
473.02 |
-5.73 |
-1.20% |
-2.84% |
| Retail |
$RLX |
3,871.64 |
-37.29 |
-0.95% |
-8.40% |
| Gold & Silver |
$XAU |
159.15 |
+3.35 |
+2.15% |
+20.16% |
| Bank |
$BKX |
129.28 |
-0.68 |
-0.52% |
-2.22% |
| Biotech |
$BTK |
5,043.21 |
-42.29 |
-0.83% |
-8.61% |
|
|
|
 |
Featured Stocks
Kenneth J. Gruneisen - Passed the CAN SLIM® Master's Exam
|
|
|
Color Codes Explained :
Y - Better candidates highlighted by our
staff of experts.
G - Previously featured
in past reports as yellow but may no longer be buyable under the
guidelines.
***Last / Change / Volume data in this table is the closing quote data***
|
|
|
THESE ARE NOT BUY RECOMMENDATIONS!
Comments contained in the body of this report are technical
opinions only. The material herein has been obtained
from sources believed to be reliable and accurate, however,
its accuracy and completeness cannot be guaranteed.
This site is not an investment advisor, hence it does
not endorse or recommend any securities or other investments.
Any recommendation contained in this report may not
be suitable for all investors and it is not to be deemed
an offer or solicitation on our part with respect to
the purchase or sale of any securities. All trademarks,
service marks and trade names appearing in this report
are the property of their respective owners, and are
likewise used for identification purposes only.
This report is a service available
only to active Paid Premium Members.
You may opt-out of receiving report notifications
at any time. Questions or comments may be submitted
by writing to Premium Membership Services 665 S.E. 10 Street, Suite 201 Deerfield Beach, FL 33441-5634 or by calling 1-800-965-8307
or 954-785-1121.
|
|
|