You are not logged in.
This means you
CAN ONLY VIEW reports that were published prior to Sunday, February 25, 2024.
You
MUST UPGRADE YOUR MEMBERSHIP if you want to see any current reports.
AFTER MARKET UPDATE - FRIDAY, MARCH 18TH, 2022
Previous After Market Report Next After Market Report >>>
|
|
|
|
DOW |
+274.17 |
34,754.93 |
+0.80% |
|
Volume |
3,437,979,400 |
+211% |
|
Volume |
8,154,715,800 |
+48% |
|
NASDAQ |
+279.06 |
13,893.84 |
+2.05% |
|
Advancers |
2,128 |
67% |
|
Advancers |
2,999 |
68% |
|
S&P 500 |
+51.45 |
4,463.12 |
+1.17% |
|
Decliners |
1,036 |
33% |
|
Decliners |
1,401 |
32% |
|
Russell 2000 |
+21.12 |
2,086.14 |
+1.02% |
|
52 Wk Highs |
59 |
|
|
52 Wk Highs |
60 |
|
|
S&P 600 |
+7.67 |
1,338.72 |
+0.58% |
|
52 Wk Lows |
57 |
|
|
52 Wk Lows |
78 |
|
|
Solid gains from all major market averages came with higher volume coupled with an increase in stocks hitting new 52-week highs on Wednesday - bullish action noted as a late follow-through day confirming a new uptrend (M criteria). Followers of the fact-based investment system know any new buying efforts may be justified only in stocks fitting all key fundamental and technical investment criteria.
|
 |
Major Averages Rose With Volume Higher on Options Expirations
Kenneth J. Gruneisen - Passed the CAN SLIM® Master's Exam
The S&P 500 climbed 1.2%, while the Nasdaq Composite surged 2.1%. Both benchmarks notched their best weekly performance since November 2020, with the broad index capping a 6.2% weekly advance and the tech-heavy Nasdaq Composite posting a 8.2% five-day gain. The Dow reversed earlier losses to jump 274 points, snapping a five-week losing streak with a 5.5% weekly gain. Volume totals reported were higher than the prior session on the NYSE and on the Nasdaq exchange, inflated by options expirations. Breadth was positive as advancers led decliners by more than a 2-1 margin on the NYSE and on the Nasdaq exchange. There were 25 high-ranked companies from the Leaders List that hit new 52-week highs and were listed on the BreakOuts Page, matching the total of 25 on the prior session. New 52-week lows totals contracted yet still outnumbered new 52-week highs totals on both the NYSE and the Nasdaq exchange. Wednesday's solid gains on higher volume coupled with an increase in stocks hitting new 52-week highs was noted as a late follow-through day confirming a new uptrend (M criteria).
Chart courtesy of www.stockcharts.com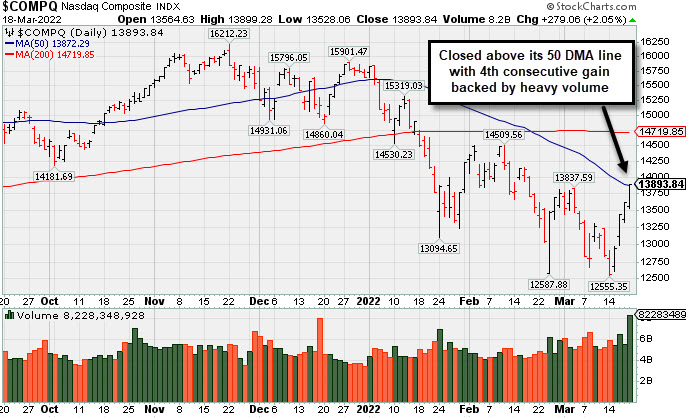 PICTURED: The Nasdaq Composite Index posted a 4th consecutive gain with heavy volume and closed above its 50-day moving average (DMA) line.
U.S. equities finished firmly higher on Friday, with Wall Street extending the week’s robust rally. Headlines around Russia and Ukraine negotiations garnered attention, despite no incremental progress being reported. Meanwhile, a highly anticipated phone call between Chinese President Xi and U.S. President Biden reportedly called on each country to promote peace in Eastern Europe.
Market participants also weighed hawkish commentary from Federal Reserve (Fed) officials. St. Louis Fed President James Bullard voiced support for the benchmark rate hitting 3%, or the equivalent of at least twelve 0.25% rate hikes this year. Minnesota Fed President Neel Kashkari (widely viewed as one of the more dovish members) said he sees seven rate hikes in 2022. On the data front, the leading index of economic indicators rebounded to 0.3% in February after falling 0.5% in January. Treasuries strengthened, with the yield on the 10-year note dropping six basis points (0.06%) to 2.14%, still ending the week 14 basis points (0.14%) higher.
Ten of 11 S&P 500 sectors closed in positive territory, with Utilities the lone laggard. Information Technology and Consumer Discretionary shares rallied more than 2%, as growth-oriented shares outperformed. In corporate news, FedEx Corp (FDX -3.98%) fell after missing earnings estimates.
|
 Kenneth J. Gruneisen started out as a licensed stockbroker in August 1987, a couple of months prior to the historic stock market crash that took the Dow Jones Industrial Average down -22.6% in a single day. He has published daily fact-based fundamental and technical analysis on high-ranked stocks online for two decades. Through FACTBASEDINVESTING.COM, Kenneth provides educational articles, news, market commentary, and other information regarding proven investment systems that work in good times and bad.
Comments contained in the body of this report are technical opinions only and are not necessarily those of Gruneisen Growth Corp. The material herein has been obtained from sources believed to be reliable and accurate, however, its accuracy and completeness cannot be guaranteed. Our firm, employees, and customers may effect transactions, including transactions contrary to any recommendation herein, or have positions in the securities mentioned herein or options with respect thereto. Any recommendation contained in this report may not be suitable for all investors and it is not to be deemed an offer or solicitation on our part with respect to the purchase or sale of any securities. |
|
 |
Retail, Broker/Dealer, and Tech Indices Rose
Kenneth J. Gruneisen - Passed the CAN SLIM® Master's Exam
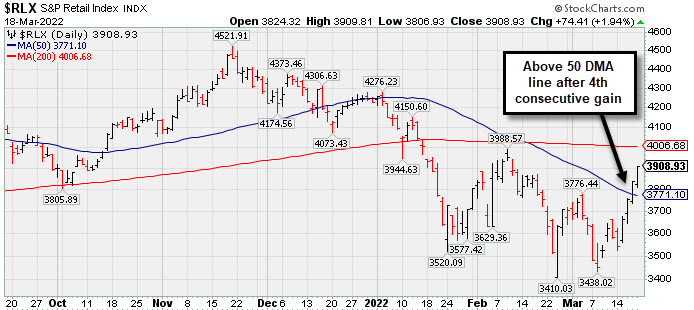
The Retail Index ($RLX +1.94%) and the Broker/Dealer Index ($XBD +1.23%) both posted solid gains on Friday while the Bank Index ($BKX -0.14%) ended slightly lower. The tech sector had a positive bias as the Semiconductor Index ($SOX +2.01%), Networking Index ($NWX +1.80%), and Biotech Index ($BTK +1.78%) posted unanimous gains. The Oil Services Index ($OSX +0.30%) edged higher and the Integrated Oil Index ($XOI -0.20%) edged lower while the Gold & Silver Index ($XAU -0.73%) suffered a bigger loss. PICTURED: The Retail Index ($RLX +1.94%) posted a 4th consecutive gain as it rebounded above its 50 DMA line this week after recently slumping to new 2022 lows. That improvement in the Retail index bodes more favorably for the market outlook because consumer spending accounts for about 2/3 of the US economy.
| Oil Services |
$OSX |
75.78 |
+0.23 |
+0.30% |
+43.74% |
| Integrated Oil |
$XOI |
1,499.23 |
-3.07 |
-0.20% |
+27.25% |
| Semiconductor |
$SOX |
3,432.30 |
+67.75 |
+2.01% |
-13.02% |
| Networking |
$NWX |
884.18 |
+15.62 |
+1.80% |
-8.95% |
| Broker/Dealer |
$XBD |
478.75 |
+5.83 |
+1.23% |
-1.67% |
| Retail |
$RLX |
3,908.93 |
+74.41 |
+1.94% |
-7.51% |
| Gold & Silver |
$XAU |
155.80 |
-1.14 |
-0.73% |
+17.63% |
| Bank |
$BKX |
129.97 |
-0.18 |
-0.14% |
-1.70% |
| Biotech |
$BTK |
5,085.50 |
+88.99 |
+1.78% |
-7.85% |
|
|
|
 |
Featured Stocks
Kenneth J. Gruneisen - Passed the CAN SLIM® Master's Exam
|
|
|
Color Codes Explained :
Y - Better candidates highlighted by our
staff of experts.
G - Previously featured
in past reports as yellow but may no longer be buyable under the
guidelines.
***Last / Change / Volume data in this table is the closing quote data***
Symbol/Exchange
Company Name
Industry Group |
PRICE |
CHANGE
(%Change) |
Day High |
Volume
(% DAV)
(% 50 day avg vol) |
52 Wk Hi
% From Hi |
Featured
Date |
Price
Featured |
Pivot Featured |
|
Max Buy |
 REGN
-
NASDAQ
REGN
-
NASDAQ
Regeneron Pharmaceutical
DRUGS - Biotechnology
|
$685.94
|
+0.71
0.10% |
$688.84
|
1,170,452
153.60% of 50 DAV
50 DAV is 762,000
|
$689.99
-0.59%
|
3/14/2022
|
$647.95
|
PP = $673.96
|
|
MB = $707.66
|
 Most Recent Note - 3/18/2022 10:26:41 PM
Y - Posted an 8th consecutive gain today with +53% above average volume helping clinch a technical buy signal. It is perched at its all-time high with no resistance remaining due to overhead supply. Color code was changed to yellow with new pivot point cited based on its 12/14/21 high plus 10 cents. Recently found support above its 200 DMA line ($611).
>>> FEATURED STOCK ARTICLE : 6th Straight Gain Leaves Regeneron Near Record High - 3/16/2022 |
View all notes |
Set NEW NOTE alert |
Company Profile |
SEC
News |
Chart |
Request a new note
C
A
S
I |
TGH
-
NYSE
Textainer Group Holdings
TRANSPORTATION - Logistics
|
$38.93
|
+0.48
1.25% |
$39.00
|
579,834
124.43% of 50 DAV
50 DAV is 466,000
|
$41.89
-7.07%
|
1/31/2022
|
$36.68
|
PP = $41.34
|
|
MB = $43.41
|
Most Recent Note - 3/18/2022 10:28:00 PM
Y - Posted a 4th consecutive gain today with ever-increasing volume. Color code was changed to yellow after rebounding above its 50 DMA line ($37.62) with 3 consecutive gains backed by light volume. Faces little resistance due to overhead supply up to the $41 level. Important near-term support to watch is its 200 DMA line ($35.17) and prior lows. Any violations would raise serious concerns and trigger technical sell signals. Fundamentals remain strong.
>>> FEATURED STOCK ARTICLE : Slumped Below 50-Day Moving Average Line Toward Prior Lows - 3/14/2022 |
View all notes |
Set NEW NOTE alert |
Company Profile |
SEC
News |
Chart |
Request a new note
C
A
S
I |
HWKN
-
NASDAQ
Hawkins Inc
CHEMICALS - Basic Chemicals
|
$45.80
|
-0.49
-1.06% |
$46.80
|
272,224
432.10% of 50 DAV
50 DAV is 63,000
|
$47.13
-2.82%
|
2/3/2022
|
$39.81
|
PP = $41.07
|
|
MB = $43.12
|
Most Recent Note - 3/18/2022 10:22:32 PM
G - Pulled back today with higher volume, encountering distributional pressure. It is extended from the previously noted base. Prior highs in the $40 area and its 50 DMA line define important near-term support to watch on pullbacks.
>>> FEATURED STOCK ARTICLE : Hovering Near High After Rising From Prior Base - 3/15/2022 |
View all notes |
Set NEW NOTE alert |
Company Profile |
SEC
News |
Chart |
Request a new note
C
A
S
I |
IMXI
-
NASDAQ
International Money Exp
Financial Svcs-Specialty
|
$21.63
|
-0.02
-0.09% |
$21.94
|
537,944
186.79% of 50 DAV
50 DAV is 288,000
|
$21.80
-0.78%
|
3/8/2022
|
$18.64
|
PP = $19.06
|
|
MB = $20.01
|
Most Recent Note - 3/18/2022 10:23:58 PM
G - Held its ground stubbornly today following 5 consecutive volume-driven gains for new all-time highs. Prior highs in the high $18 area define initial support to watch on pullbacks.
>>> FEATURED STOCK ARTICLE : Volume-Driven Gains Challenged All-Time High - 3/8/2022 |
View all notes |
Set NEW NOTE alert |
Company Profile |
SEC
News |
Chart |
Request a new note
C
A
S
I |
|
|
|
THESE ARE NOT BUY RECOMMENDATIONS!
Comments contained in the body of this report are technical
opinions only. The material herein has been obtained
from sources believed to be reliable and accurate, however,
its accuracy and completeness cannot be guaranteed.
This site is not an investment advisor, hence it does
not endorse or recommend any securities or other investments.
Any recommendation contained in this report may not
be suitable for all investors and it is not to be deemed
an offer or solicitation on our part with respect to
the purchase or sale of any securities. All trademarks,
service marks and trade names appearing in this report
are the property of their respective owners, and are
likewise used for identification purposes only.
This report is a service available
only to active Paid Premium Members.
You may opt-out of receiving report notifications
at any time. Questions or comments may be submitted
by writing to Premium Membership Services 665 S.E. 10 Street, Suite 201 Deerfield Beach, FL 33441-5634 or by calling 1-800-965-8307
or 954-785-1121.
|
|
|