You are not logged in.
This means you
CAN ONLY VIEW reports that were published prior to Tuesday, February 20, 2024.
You
MUST UPGRADE YOUR MEMBERSHIP if you want to see any current reports.
AFTER MARKET UPDATE - WEDNESDAY, MARCH 18TH, 2020
Previous After Market Report Next After Market Report >>>
|
|
|
|
DOW |
-1,338.46 |
19,898.92 |
-6.30% |
|
Volume |
1,930,751,710 |
-2% |
|
Volume |
4,872,292,100 |
+0% |
|
NASDAQ |
-344.94 |
6,989.84 |
-4.70% |
|
Advancers |
182 |
6% |
|
Advancers |
339 |
10% |
|
S&P 500 |
-131.09 |
2,398.10 |
-5.18% |
|
Decliners |
2,730 |
94% |
|
Decliners |
3,000 |
90% |
|
Russell 2000 |
-115.34 |
991.16 |
-10.42% |
|
52 Wk Highs |
14 |
|
|
52 Wk Highs |
16 |
|
|
S&P 600 |
-69.24 |
600.82 |
-10.33% |
|
52 Wk Lows |
2,235 |
|
|
52 Wk Lows |
1,698 |
|
|
During market corrections it is especially important to reduce exposure, preserve your capital, and just be patient. Be safe! Historic studies have shown that the biggest up sessions have occurred during market corrections and bear markets.
Disciplined investors know to wait until a new confirmed rally marked by a solid follow-through day. The bold portion of the daily market commentary will note when that happens. For any clarification or additional help applying the fact-based investment system, we invite members to call, or contact us via the inquiry form.
|
 |
Decisively Negative Market Stings Investors Yet Again
Kenneth J. Gruneisen - Passed the CAN SLIM® Master's Exam
The Dow slumped 1,338 points to 19,898. The S&P 500 slid 5.2%, down 29% from its all-time high reached a month ago. The Nasdaq Composite shed 4.7%. Breadth was negative as advancers led decliners by a 4-3 margin on the NYSE and by 2-1 on the Nasdaq exchange. The reported volume totals were mixed, lighter than the prior session total on the NYSE and higher on the Nasdaq exchange. Leadership remained thin as there were 4 high-ranked companies from the Leaders List that hit a new 52-week high and were listed on the BreakOuts Page versus 5 on the prior session. New 52-week lows totals swelled again and decisively outnumbered new 52-week highs totals on both the NYSE and on the Nasdaq exchange. The major indices' (M criteria) have been in a noted "market correction" and investors have been prompted since February 25th to reduce market exposure. Disciplined investors know to watch for a follow-through day of gains on higher volume to confirm a new market uptrend before initiating any new buying efforts. The Featured Stocks Page provides the most timely analysis on high-ranked leaders. Charts used courtesy of www.stockcharts.com
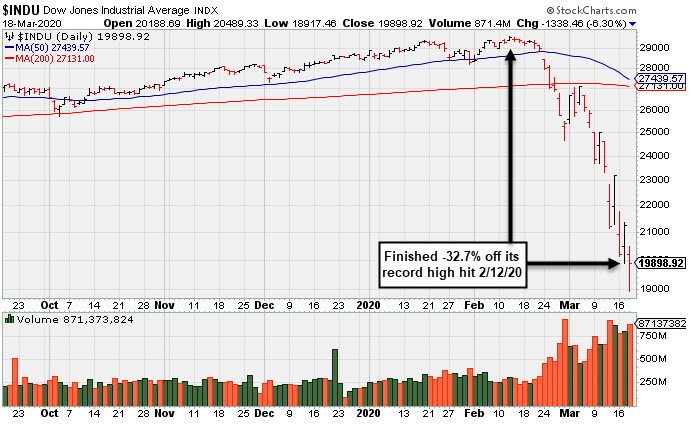
PICTURED: The Dow Jones Industrial Average finished -32.7% off the all-time high hit on 2/12/20. Stocks, bonds, and commodities all finished firmly lower on Wednesday, as investors continued to grapple over the economic impact of the COVID-19 pandemic. Volatility whipsawed markets, with the NYSE circuit breaker halting equity trading during the afternoon. However, the sell-off lessened following reports the Senate had enough votes to pass a bill expanding paid time off and unemployment benefits, and the Trump Administration was reportedly seeking a fiscal stimulus package in excess of $1 trillion.
Amid the likelihood of increased government spending, Treasuries declined, sending yields higher a day after rates surged the most since 1982. The yield on the 10-year note and 30-year bond both jumped 12 basis points 1.21% and 1.82%, respectively. In commodities, WTI crude posted its third worst day in history. Prices tumbled 17.6% to $22.20/barrel, the lowest level since February 2002. COMEX gold lost 2% to $1,495.10/ounce. Meanwhile, the U.S. dollar strengthened to the highest level since March 2017 against a basket of its peers.
All 11 S&P 500 sectors are finished in negative territory. The Energy sector led laggards with a 14.3% drop amid a historic drop in WTI crude prices. In corporate news, Boeing (BA -17.92%) fell after publicly seeking $60 billion in private and public funding to meet liquidity needs. Some Consumer Staples stocks offered a bright spot, with Walmart (WMT +2.78%) and Kroger (KR +2.76%) both gaining after each company was the subject of an analysts’ upgrade. |
 Kenneth J. Gruneisen started out as a licensed stockbroker in August 1987, a couple of months prior to the historic stock market crash that took the Dow Jones Industrial Average down -22.6% in a single day. He has published daily fact-based fundamental and technical analysis on high-ranked stocks online for two decades. Through FACTBASEDINVESTING.COM, Kenneth provides educational articles, news, market commentary, and other information regarding proven investment systems that work in good times and bad.
Comments contained in the body of this report are technical opinions only and are not necessarily those of Gruneisen Growth Corp. The material herein has been obtained from sources believed to be reliable and accurate, however, its accuracy and completeness cannot be guaranteed. Our firm, employees, and customers may effect transactions, including transactions contrary to any recommendation herein, or have positions in the securities mentioned herein or options with respect thereto. Any recommendation contained in this report may not be suitable for all investors and it is not to be deemed an offer or solicitation on our part with respect to the purchase or sale of any securities. |
|
 |
Commodity-Linked Groups, Financial, and Tech Tumbled Again
Kenneth J. Gruneisen - Passed the CAN SLIM® Master's Exam
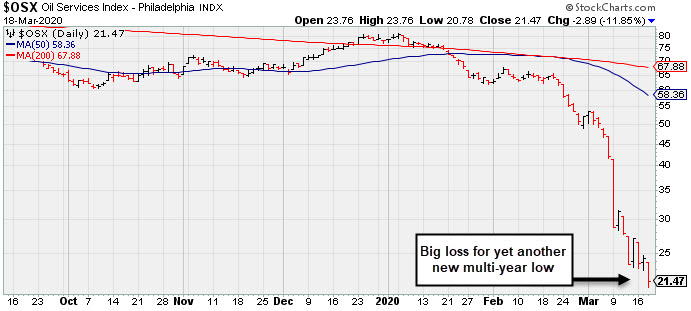
Commodity-linked groups were very weak again as the Oil Services Index ($OSX -11.85%) and the Integrated Oil Index ($XOI -12.53%) fell precipitously along with the Gold & Silver Index ($XAU -13.58%). The Bank Index ($BKX -8.25%) and Broker/Dealer Index ($XBD -10.23%) also suffered big losses. The Retail Index ($RLX -3.44%) held its ground admirably, relative to the steep losses elsewhere. The tech sector was led lower by the Semiconductor Index ($SOX -9.79%) as the Networking Index ($NWX -6.29%) and the Biotech Index ($BTK -3.43%) posted smaller losses.
PICTURED: The Oil Services Index ($OSX -11.85%) suffered a big loss for yet another new multi-year low.
| Oil Services |
$OSX |
21.47 |
-2.89 |
-11.86% |
-72.58% |
| Integrated Oil |
$XOI |
469.68 |
-67.26 |
-12.53% |
-63.03% |
| Semiconductor |
$SOX |
1,286.84 |
-139.68 |
-9.79% |
-30.43% |
| Networking |
$NWX |
379.44 |
-25.45 |
-6.29% |
-34.96% |
| Broker/Dealer |
$XBD |
187.20 |
-21.32 |
-10.23% |
-35.53% |
| Retail |
$RLX |
1,995.91 |
-71.15 |
-3.44% |
-18.51% |
| Gold & Silver |
$XAU |
73.45 |
-11.55 |
-13.59% |
-31.30% |
| Bank |
$BKX |
60.72 |
-5.46 |
-8.25% |
-46.44% |
| Biotech |
$BTK |
3,910.33 |
-138.75 |
-3.43% |
-22.83% |
|
|
|
 |
No Featured Stocks
Kenneth J. Gruneisen - Passed the CAN SLIM® Master's Exam
During extremely bearish markets the number of stocks covered in this area has sometimes been reduced to zero. We suggest making no excuses for weak stocks in weak markets. Feel free to contact us if you have a need for any additional information. |
|
|
Color Codes Explained :
Y - Better candidates highlighted by our
staff of experts.
G - Previously featured
in past reports as yellow but may no longer be buyable under the
guidelines.
***Last / Change / Volume data in this table is the closing quote data***
|
|
|
THESE ARE NOT BUY RECOMMENDATIONS!
Comments contained in the body of this report are technical
opinions only. The material herein has been obtained
from sources believed to be reliable and accurate, however,
its accuracy and completeness cannot be guaranteed.
This site is not an investment advisor, hence it does
not endorse or recommend any securities or other investments.
Any recommendation contained in this report may not
be suitable for all investors and it is not to be deemed
an offer or solicitation on our part with respect to
the purchase or sale of any securities. All trademarks,
service marks and trade names appearing in this report
are the property of their respective owners, and are
likewise used for identification purposes only.
This report is a service available
only to active Paid Premium Members.
You may opt-out of receiving report notifications
at any time. Questions or comments may be submitted
by writing to Premium Membership Services 665 S.E. 10 Street, Suite 201 Deerfield Beach, FL 33441-5634 or by calling 1-800-965-8307
or 954-785-1121.
|
|
|