You are not logged in.
This means you
CAN ONLY VIEW reports that were published prior to Tuesday, February 20, 2024.
You
MUST UPGRADE YOUR MEMBERSHIP if you want to see any current reports.
AFTER MARKET UPDATE - FRIDAY, MARCH 13TH, 2020
Previous After Market Report Next After Market Report >>>
|
|
|
|
DOW |
+1,985.00 |
23,185.62 |
+9.36% |
|
Volume |
2,059,799,250 |
-5% |
|
Volume |
4,670,503,200 |
-7% |
|
NASDAQ |
+673.08 |
7,874.88 |
+9.35% |
|
Advancers |
2,537 |
88% |
|
Advancers |
2,459 |
74% |
|
S&P 500 |
+230.38 |
2,711.02 |
+9.29% |
|
Decliners |
351 |
12% |
|
Decliners |
864 |
26% |
|
Russell 2000 |
+87.20 |
1,210.13 |
+7.77% |
|
52 Wk Highs |
3 |
|
|
52 Wk Highs |
7 |
|
|
S&P 600 |
+54.16 |
725.46 |
+8.07% |
|
52 Wk Lows |
644 |
|
|
52 Wk Lows |
833 |
|
|
During market corrections it is especially important to reduce exposure, preserve your capital, and just be patient. Be safe! Historic studies have shown that the biggest up sessions have occurred during market corrections and bear markets.
Disciplined investors know to wait until a new confirmed rally marked by a solid follow-through day. The bold portion of the daily market commentary will note when that happens. For any clarification or additional help applying the fact-based investment system, we invite members to call, or contact us via the inquiry form.
|
 |
Major Indices Rebound Off Lows Following Damaging Decline
Kenneth J. Gruneisen - Passed the CAN SLIM® Master's Exam
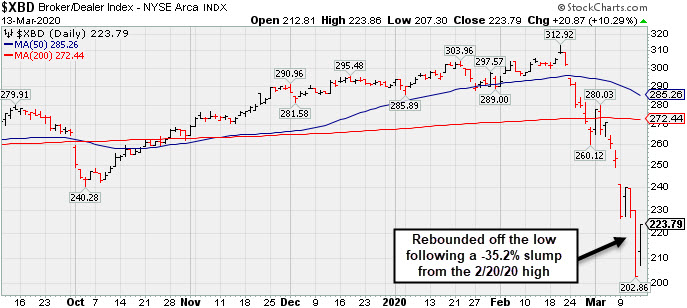
For the week, the Dow fell 10.4%, the S&P 500 shed 8.8%, and the Nasdaq Composite lost 8.2%. On Friday the Dow climbed 1,985 points, rebounding from its worst session since 1987 on Thursday. The S&P 500 rallied 9.3%, its best day since October 2008, while the Nasdaq Composite advanced by the same percentage. Breadth was decisively positive as advancers led decliners by a 7-1 margin on the NYSE and by nearly 3-1 on the Nasdaq exchange. The reported volume totals were lighter than the prior session totals on the NYSE and on the Nasdaq exchange. Leadership remained thin as for the 2nd consecutive session there were zero high-ranked companies from the Leaders List that hit a new 52-week high and were listed on the BreakOuts Page. New 52-week lows outnumbered new 52-week highs totals which were in the single digits on both the NYSE and on the Nasdaq exchange. The major indices' (M criteria) have been in a noted "market correction" and investors have been prompted since February 25th to reduce market exposure. Disciplined investors know to watch for a follow-through day of gains on higher volume to confirm a new market uptrend before initiating any new buying efforts. The Featured Stocks Page provides the most timely analysis on high-ranked leaders. Charts used courtesy of www.stockcharts.com
PICTURED: The Dow Jones Industrial Average rebounded off the low after a steep -28.5% decline from the all-time high hit on 2/12/20. It precipitously fell, violating its 50 and 200-day moving average lines and sinking below the October 2019 low. Stocks finished firmly higher on Friday. Unprecedented stimulus measures from central banks and governments around the world help fuel a relief rally in global equities. A liquidity injection from the Bank of Japan, short-selling bans across Europe, and news that Congressional Democrats and the Trump Administration were nearing a coronavirus relief package helped shore up Wall Street sentiment Friday morning. The gains were pared somewhat as the session wore on, however, as investors continue to digest the ongoing economic fallout from the global coronavirus pandemic. An afternoon speech from President Trump reignited optimism, as he announced a state of emergency which made available $50 billion of funding to help combat the virus.
All 11 S&P 500 sectors closed in positive territory, paring weekly declines. Financials paced gains on Friday, surging more than 13% amid an uptick in Treasury yields. Energy stocks lagged for the week, dropping 24%, as WTI crude experienced its worst week since 2008.
Treasuries declined for the third-straight session, with the yield on the 10-year note up 11 basis points to 0.99% after having touched an all-time low of 0.31% on Monday. On the data front, a preliminary report from the University of Michigan showed U.S. consumer sentiment fell less-than-expected in early March. |
 Kenneth J. Gruneisen started out as a licensed stockbroker in August 1987, a couple of months prior to the historic stock market crash that took the Dow Jones Industrial Average down -22.6% in a single day. He has published daily fact-based fundamental and technical analysis on high-ranked stocks online for two decades. Through FACTBASEDINVESTING.COM, Kenneth provides educational articles, news, market commentary, and other information regarding proven investment systems that work in good times and bad.
Comments contained in the body of this report are technical opinions only and are not necessarily those of Gruneisen Growth Corp. The material herein has been obtained from sources believed to be reliable and accurate, however, its accuracy and completeness cannot be guaranteed. Our firm, employees, and customers may effect transactions, including transactions contrary to any recommendation herein, or have positions in the securities mentioned herein or options with respect thereto. Any recommendation contained in this report may not be suitable for all investors and it is not to be deemed an offer or solicitation on our part with respect to the purchase or sale of any securities. |
|
 |
Energy and Financial Indexes Rebound; Tech and Retail Follow
Kenneth J. Gruneisen - Passed the CAN SLIM® Master's Exam
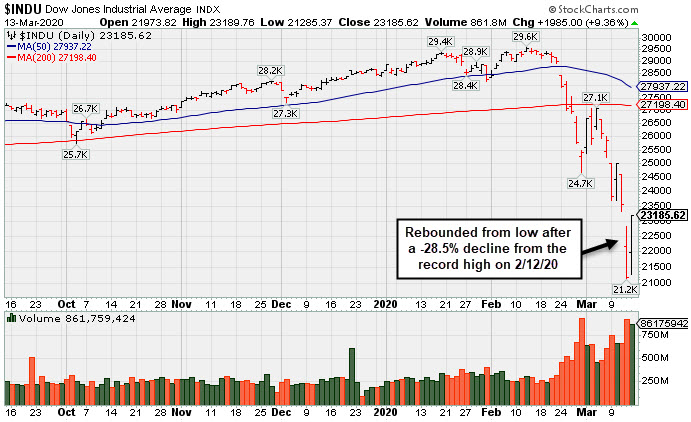
Commodity-linked groups were mixed as the Oil Services Index ($OSX +14.76%) and the Integrated Oil Index ($XOI +9.22%) rebounded, meanwhile, the Gold & Silver Index ($XAU -9.67%) suffered another big loss. The Bank Index ($BKX +14.83%) and Broker/Dealer Index ($XBD +10.29%) both outpaced the Retail Index ($RLX +6.40%). The tech sector had a positive bias as the Semiconductor Index ($SOX +10.93%), Networking Index ($NWX +6.78%), and the Biotech Index ($BTK +6.41%) posted big gains.
PICTURED: The Broker/Dealer Index ($XBD +10.29%) rebounded off the low after a -35.2% precipitous plunge from the 2/20/20 high. Longtime readers of this commentary should recognize that weakness in the financial groups bodes poorly for the broader market outlook, because the financial indices have been very reliable leading indicators for the broader market.
| Oil Services |
$OSX |
27.09 |
+3.49 |
+14.79% |
-65.40% |
| Integrated Oil |
$XOI |
634.60 |
+53.57 |
+9.22% |
-50.05% |
| Semiconductor |
$SOX |
1,544.26 |
+152.15 |
+10.93% |
-16.51% |
| Networking |
$NWX |
432.30 |
+27.43 |
+6.78% |
-25.90% |
| Broker/Dealer |
$XBD |
223.79 |
+20.87 |
+10.29% |
-22.93% |
| Retail |
$RLX |
2,187.28 |
+131.49 |
+6.40% |
-10.70% |
| Gold & Silver |
$XAU |
70.26 |
-7.52 |
-9.67% |
-34.29% |
| Bank |
$BKX |
74.55 |
+9.62 |
+14.82% |
-34.24% |
| Biotech |
$BTK |
4,345.64 |
+261.69 |
+6.41% |
-14.24% |
|
|
|
 |
No Featured Stocks
Kenneth J. Gruneisen - Passed the CAN SLIM® Master's Exam
During extremely bearish markets the number of stocks covered in this area has sometimes been reduced to zero. We suggest making no excuses for weak stocks in weak markets. Feel free to contact us if you have a need for any additional information. |
|
|
Color Codes Explained :
Y - Better candidates highlighted by our
staff of experts.
G - Previously featured
in past reports as yellow but may no longer be buyable under the
guidelines.
***Last / Change / Volume data in this table is the closing quote data***
|
|
|
THESE ARE NOT BUY RECOMMENDATIONS!
Comments contained in the body of this report are technical
opinions only. The material herein has been obtained
from sources believed to be reliable and accurate, however,
its accuracy and completeness cannot be guaranteed.
This site is not an investment advisor, hence it does
not endorse or recommend any securities or other investments.
Any recommendation contained in this report may not
be suitable for all investors and it is not to be deemed
an offer or solicitation on our part with respect to
the purchase or sale of any securities. All trademarks,
service marks and trade names appearing in this report
are the property of their respective owners, and are
likewise used for identification purposes only.
This report is a service available
only to active Paid Premium Members.
You may opt-out of receiving report notifications
at any time. Questions or comments may be submitted
by writing to Premium Membership Services 665 S.E. 10 Street, Suite 201 Deerfield Beach, FL 33441-5634 or by calling 1-800-965-8307
or 954-785-1121.
|
|
|