***Last / Change / Volume data in this table is the closing quote data***
Symbol/Exchange
Company Name
Industry Group |
PRICE |
CHANGE
(%Change) |
Day High |
Volume
(% DAV)
(% 50 day avg vol) |
52 Wk Hi
% From Hi |
Featured
Date |
Price
Featured |
Pivot Featured |
|
Max Buy |
MLR
-
NYSE
Miller Industries Inc
AUTOMOTIVE - Auto Parts
|
$33.35
|
-0.35
-1.04% |
$33.88
|
32,377
104.44% of 50 DAV
50 DAV is 31,000
|
$35.26
-5.42%
|
11/30/2018
|
$28.35
|
PP = $29.50
|
|
MB = $30.98
|
Most Recent Note - 3/11/2019 12:22:23 PM
G - Still trading near its 52-week high after enduring distributional pressure last week. Reported earnings +17% on +13% sales revenues for the Dec '18 quarter, below the +25% minimum guideline (C criteria), raising fundamental concerns. Its 50 DMA line ($30.31) and prior highs in the $29 area define near-term support to watch.
>>> FEATURED STOCK ARTICLE : Extended From Prior Base After Impressive Streak of Gains - 3/1/2019 |
View all notes |
Set NEW NOTE alert |
Company Profile |
SEC
News |
Chart |
Request a new note
C
A
S
I |
NSP
-
NYSE
Insperity Inc
Comml Svcs-Outsourcing
|
$123.53
|
+0.07
0.06% |
$125.20
|
296,550
85.22% of 50 DAV
50 DAV is 348,000
|
$132.50
-6.77%
|
2/11/2019
|
$127.91
|
PP = $121.25
|
|
MB = $127.31
|
Most Recent Note - 3/11/2019 6:06:08 PM
Y - Still quietly consolidating below its "max buy" level. Prior highs in the $119-121 area define important near-term support to watch on pullbacks.
>>> FEATURED STOCK ARTICLE : Big Breakaway Gap Triggered Technical Buy Signal - 2/11/2019 |
View all notes |
Set NEW NOTE alert |
Company Profile |
SEC
News |
Chart |
Request a new note
C
A
S
I |
ZBRA
-
NASDAQ
Zebra Tech Corp Cl A
COMPUTER HARDWARE - Computer Peripherals
|
$211.53
|
+0.81
0.38% |
$212.94
|
569,557
116.47% of 50 DAV
50 DAV is 489,000
|
$211.93
-0.19%
|
2/14/2019
|
$198.10
|
PP = $184.85
|
|
MB = $194.09
|
Most Recent Note - 3/11/2019 6:15:58 PM
G - Posted a big gain for a new all-time high with near average volume today, ending near the session high. Extended from the prior base. Prior highs in the $184 area define initial support to watch on pullbacks.
>>> FEATURED STOCK ARTICLE : Big Volume-Driven Gain for New High - 2/14/2019 |
View all notes |
Set NEW NOTE alert |
Company Profile |
SEC
News |
Chart |
Request a new note
C
A
S
I |
SPSC
-
NASDAQ
S P S Commerce Inc
COMPUTER SOFTWARE and SERVICES - Application Software
|
$106.53
|
-0.88
-0.82% |
$107.75
|
138,869
87.89% of 50 DAV
50 DAV is 158,000
|
$113.31
-5.98%
|
2/13/2019
|
$104.30
|
PP = $100.78
|
|
MB = $105.82
|
 Most Recent Note - 3/13/2019 7:10:29 PM
G - Color code is changed to green while consolidating just above its "max buy" level. Prior highs in the $100 area define initial support to watch.
>>> FEATURED STOCK ARTICLE : Gap Up and Big Volume Driven Gain for New High - 2/13/2019 |
View all notes |
Set NEW NOTE alert |
Company Profile |
SEC
News |
Chart |
Request a new note
C
A
S
I |
SSNC
-
NASDAQ
S S & C Technologies
COMPUTER SOFTWARE and SERVICES - Application Software
|
$62.32
|
+0.21
0.34% |
$63.27
|
1,515,537
82.50% of 50 DAV
50 DAV is 1,837,000
|
$64.36
-3.17%
|
2/15/2019
|
$59.73
|
PP = $61.07
|
|
MB = $64.12
|
Most Recent Note - 3/11/2019 6:20:37 PM
Y - Posted a big gain today with below average volume, ending near the session high. Rebounded impressively from a deep loss after gapping down on the prior session. Stalled after a 3/01/19 gain above its pivot point backed by +49% above average volume triggered a technical buy signal.
>>> FEATURED STOCK ARTICLE : Volume-Driven Gain for New High Close - 2/19/2019 |
View all notes |
Set NEW NOTE alert |
Company Profile |
SEC
News |
Chart |
Request a new note
C
A
S
I |
Symbol/Exchange
Company Name
Industry Group |
PRICE |
CHANGE
(%Change) |
Day High |
Volume
(% DAV)
(% 50 day avg vol) |
52 Wk Hi
% From Hi |
Featured
Date |
Price
Featured |
Pivot Featured |
|
Max Buy |
IRBT
-
NASDAQ
Irobot Corp
CONSUMER DURABLES - Electronic Equipment
|
$125.03
|
+1.05
0.85% |
$126.52
|
484,541
58.45% of 50 DAV
50 DAV is 829,000
|
$132.88
-5.91%
|
2/8/2019
|
$104.92
|
PP = $103.63
|
|
MB = $108.81
|
Most Recent Note - 3/12/2019 5:48:57 PM
G - Posted a 3rd consecutive gain with light volume. There was a "negative reversal" on 3/05/19 after quietly touching another new all-time high. Recent gains have lacked great volume conviction. It is extended from the previously noted "double bottom" base. See the latest FSU analysis for more details and a new annotated graph.
>>> FEATURED STOCK ARTICLE : Consolidating After Getting Extended from Double Bottom Base - 3/12/2019 |
View all notes |
Set NEW NOTE alert |
Company Profile |
SEC
News |
Chart |
Request a new note
C
A
S
I |
LHCG
-
NASDAQ
L H C Group Inc
HEALTH SERVICES - Home Health Care
|
$110.44
|
+0.24
0.22% |
$111.98
|
194,233
75.87% of 50 DAV
50 DAV is 256,000
|
$114.22
-3.31%
|
1/23/2019
|
$107.29
|
PP = $107.61
|
|
MB = $112.99
|
Most Recent Note - 3/12/2019 5:50:44 PM
Y - Still hovering near its all-time high, not extended from the prior base. Recently found support at its 50 DMA line. Bullish action came after it reported earnings +66% on +75% sales revenues for the Dec '18 quarter.
>>> FEATURED STOCK ARTICLE : Recent Gains for New Highs Lacked Great Volume Conviction - 2/21/2019 |
View all notes |
Set NEW NOTE alert |
Company Profile |
SEC
News |
Chart |
Request a new note
C
A
S
I |
ENSG
-
NASDAQ
Ensign Group Inc
HEALTH SERVICES - Long-Term Care Facilities
|
$50.58
|
+0.78
1.57% |
$51.02
|
282,402
85.84% of 50 DAV
50 DAV is 329,000
|
$54.56
-7.29%
|
2/7/2019
|
$48.71
|
PP = $49.06
|
|
MB = $51.51
|
Most Recent Note - 3/11/2019 6:04:35 PM
Y - Found support while recently consolidating near prior highs in the $48 area, well above its 50 DMA line ($45.25) defining the next important near-term support level to watch. See the latest FSU analysis for more details and a new annotated graph.
>>> FEATURED STOCK ARTICLE : Consolidating Near Proir High and Above 50-Day Average - 3/11/2019 |
View all notes |
Set NEW NOTE alert |
Company Profile |
SEC
News |
Chart |
Request a new note
C
A
S
I |
NXST
-
NASDAQ
Nexstar Media Group Cl A
MEDIA - Broadcasting - TV
|
$106.68
|
+1.33
1.26% |
$107.63
|
597,735
109.68% of 50 DAV
50 DAV is 545,000
|
$105.97
0.67%
|
2/26/2019
|
$94.26
|
PP = $89.76
|
|
MB = $94.25
|
Most Recent Note - 3/13/2019 7:07:11 PM
G - Posted a 4th consecutive gain with near average volume today hitting another new all-time high. Disciplined investors avoid chasing stocks more than +5% above the prior high.
>>> FEATURED STOCK ARTICLE : Twice Average Volume Behind Gain for New High - 2/26/2019 |
View all notes |
Set NEW NOTE alert |
Company Profile |
SEC
News |
Chart |
Request a new note
C
A
S
I |
BSTC
-
NASDAQ
Biospecifics Technologie
Medical-Biomed/Biotech
|
$67.72
|
-1.58
-2.28% |
$70.21
|
39,743
90.33% of 50 DAV
50 DAV is 44,000
|
$73.31
-7.63%
|
1/18/2019
|
$67.40
|
PP = $66.31
|
|
MB = $69.63
|
Most Recent Note - 3/13/2019 7:13:35 PM
Y - Due to report earnings news, and volume and volatility often increase near earnings news. Consolidating near prior highs and above its 50 DMA line ($66.11) defining important near-term support to watch. More damaging losses would raise concerns and trigger a technical sell signal.
>>> FEATURED STOCK ARTICLE : Consolidating Above 50-Day Moving Average and Prior Highs - 3/7/2019 |
View all notes |
Set NEW NOTE alert |
Company Profile |
SEC
News |
Chart |
Request a new note
C
A
S
I |
Symbol/Exchange
Company Name
Industry Group |
PRICE |
CHANGE
(%Change) |
Day High |
Volume
(% DAV)
(% 50 day avg vol) |
52 Wk Hi
% From Hi |
Featured
Date |
Price
Featured |
Pivot Featured |
|
Max Buy |
UBNT
-
NASDAQ
Ubiquiti Networks
TELECOMMUNICATIONS - Diversified Communication Serv
|
$142.10
|
-0.37
-0.26% |
$144.14
|
215,099
59.09% of 50 DAV
50 DAV is 364,000
|
$148.68
-4.43%
|
2/8/2019
|
$121.97
|
PP = $115.54
|
|
MB = $121.32
|
Most Recent Note - 3/12/2019 5:51:52 PM
G - Holding its ground perched near its all-time high with volume totals cooling, very extended from the prior base. Fundamentals remain strong. Prior high ($115) defines initial support to watch on pullbacks.
>>> FEATURED STOCK ARTICLE : Bullish Action Came Following Another Strong Earnings Report - 3/5/2019 |
View all notes |
Set NEW NOTE alert |
Company Profile |
SEC
News |
Chart |
Request a new note
C
A
S
I |
NOW
-
NYSE
Servicenow Inc
Computer Sftwr-Enterprse
|
$240.39
|
+1.68
0.70% |
$243.42
|
1,851,566
85.92% of 50 DAV
50 DAV is 2,155,000
|
$245.33
-2.01%
|
1/31/2019
|
$218.14
|
PP = $206.40
|
|
MB = $216.72
|
Most Recent Note - 3/13/2019 7:06:22 PM
G - Perched near its all-time high after another gain today with lighter volume, extended from any sound base. Its 50 DMA line ($213) defines near-term support above the prior high ($206).
>>> FEATURED STOCK ARTICLE : Pulling Back After 6 Straight Weekly Gains - 3/6/2019 |
View all notes |
Set NEW NOTE alert |
Company Profile |
SEC
News |
Chart |
Request a new note
C
A
S
I |
PANW
-
NYSE
Palo Alto Networks
Computer Sftwr-Security
|
$242.75
|
+2.53
1.05% |
$245.03
|
1,132,249
79.40% of 50 DAV
50 DAV is 1,426,000
|
$260.63
-6.86%
|
2/25/2019
|
$233.54
|
PP = $239.60
|
|
MB = $251.58
|
Most Recent Note - 3/11/2019 6:18:28 PM
Y - Posted a 4th consecutive gain today with below average volume, rebounding above its pivot point after a recent slump into the prior base had raised concerns. Reported earnings +44% on +30% sales revenues for the Jan '19 quarter, continuing its strong earnings track record.
>>> FEATURED STOCK ARTICLE : Rebounded Near Prior High With Earnings News Due - 2/25/2019 |
View all notes |
Set NEW NOTE alert |
Company Profile |
SEC
News |
Chart |
Request a new note
C
A
S
I |
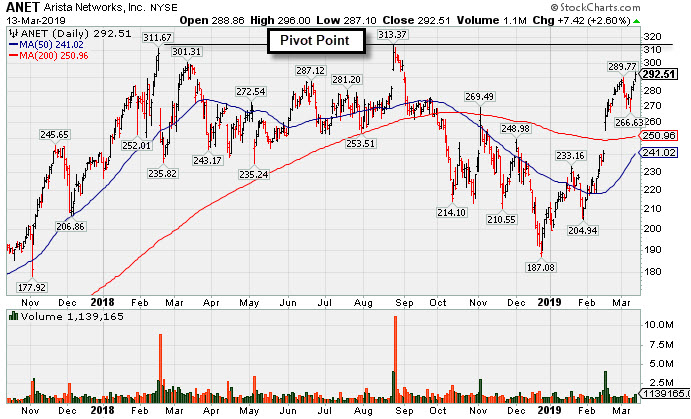
ANET
-
NYSE
Arista Networks Inc
TELECOMMUNICATIONS - Communication Equipment
|
$292.51
|
+7.42
2.60% |
$296.00
|
1,131,316
130.94% of 50 DAV
50 DAV is 864,000
|
$313.37
-6.66%
|
3/13/2019
|
$295.38
|
PP = $313.37
|
|
MB = $329.04
|
Most Recent Note - 3/13/2019 7:04:15 PM
Y - Posted a 3rd consecutive gain today while highlighted in yellow in the earlier mid-day report (read here) with new pivot point cited based on its 8/24/18 high plus 10 cents. Challenging previously stubborn resistance in the $311-313 area with recent gains lacking great volume conviction. Subsequent gains for new highs backed by at least +40% may trigger a technical buy signal. Fundamentals remained strong through the Dec '18 quarter. Went through a deep consolidation below its 200 DMA line after dropped from the Featured Stocks list on 10/05/18. See the latest FSU analysis for more details and a new annotated graph.
>>> FEATURED STOCK ARTICLE : Rebounding Near High After Deep Consolidation - 3/13/2019 |
View all notes |
Set NEW NOTE alert |
Company Profile |
SEC
News |
Chart |
Request a new note
C
A
S
I |
PAYC
-
NYSE
Paycom Software Inc
COMPUTER SOFTWARE and SERVICES - Application Software
|
$181.03
|
-1.26
-0.69% |
$184.16
|
446,212
68.65% of 50 DAV
50 DAV is 650,000
|
$186.00
-2.67%
|
2/6/2019
|
$171.66
|
PP = $164.18
|
|
MB = $172.39
|
Most Recent Note - 3/8/2019 6:56:13 PM
G - Managed a "positive reversal" today after early weakness. It is extended from any sound base. the prior high ($164) defines initial support to watch above its 50 DMA line ($152.77). See the latest FSU analysis for more details and a new annotated graph.
>>> FEATURED STOCK ARTICLE : Consolidating Near All-Time High - 3/8/2019 |
View all notes |
Set NEW NOTE alert |
Company Profile |
SEC
News |
Chart |
Request a new note
C
A
S
I |
Symbol/Exchange
Company Name
Industry Group |
PRICE |
CHANGE
(%Change) |
Day High |
Volume
(% DAV)
(% 50 day avg vol) |
52 Wk Hi
% From Hi |
Featured
Date |
Price
Featured |
Pivot Featured |
|
Max Buy |
PYPL
-
NASDAQ
Paypal Holdings Inc
Finance-CrdtCard/PmtPr
|
$99.31
|
+1.81
1.86% |
$100.59
|
9,330,461
118.23% of 50 DAV
50 DAV is 7,892,000
|
$99.45
-0.14%
|
1/24/2019
|
$92.56
|
PP = $93.80
|
|
MB = $98.49
|
Most Recent Note - 3/13/2019 7:18:22 PM
G - Posted a solid gain today with +18% above average volume and color code is changed to green after it finished above its "max buy" level. Recent gains into new high territory came with lackluster volume, not indicative of great institutional buying demand. Prior highs in the $92 area define support above its 50 DMA line ($92.68).
>>> FEATURED STOCK ARTICLE : Wedging into New High Territory With Gains Lacking Volume - 2/22/2019 |
View all notes |
Set NEW NOTE alert |
Company Profile |
SEC
News |
Chart |
Request a new note
C
A
S
I |
ALRM
-
NASDAQ
Alarm.com Holdings Inc
Security/Sfty
|
$60.95
|
+0.52
0.86% |
$61.52
|
452,689
78.46% of 50 DAV
50 DAV is 577,000
|
$65.85
-7.44%
|
1/22/2019
|
$60.52
|
PP = $60.30
|
|
MB = $63.32
|
Most Recent Note - 3/11/2019 6:13:59 PM
G - Rebounded near its 50 DMA line ($59.76) with today's 3rd consecutive gain backed by near average volume. Weak action came after it reported earnings +12% on +25% sales revenues for the Dec '18 quarter, below the +25% minimum earnings guideline (C criteria), raising fundamental concerns.
>>> FEATURED STOCK ARTICLE : Volume Totals Cooling While Perched at All-Time High - 2/20/2019 |
View all notes |
Set NEW NOTE alert |
Company Profile |
SEC
News |
Chart |
Request a new note
C
A
S
I |
PLNT
-
NYSE
Planet Fitness Inc Cl A
Leisure-Services
|
$67.06
|
+0.49
0.74% |
$67.79
|
1,670,985
117.84% of 50 DAV
50 DAV is 1,418,000
|
$66.81
0.37%
|
11/7/2018
|
$57.10
|
PP = $55.45
|
|
MB = $58.22
|
Most Recent Note - 3/13/2019 7:09:12 PM
G - Posted a 12th consecutive gain today with ever-decreasing volume while hitting another new all-time high. Rallying after testing support at its 50 DMA line ($58.77). Reported earnings +42% on +30% sales revenues for the Dec '18 quarter.
>>> FEATURED STOCK ARTICLE : Met Distributional Pressure While Hitting New High After Earnings - 2/27/2019 |
View all notes |
Set NEW NOTE alert |
Company Profile |
SEC
News |
Chart |
Request a new note
C
A
S
I |
TEAM
-
NASDAQ
Atlassian Corp Plc Cl A
Comp Sftwr-Spec Enterprs
|
$108.58
|
-2.36
-2.13% |
$112.58
|
3,581,396
205.59% of 50 DAV
50 DAV is 1,742,000
|
$112.45
-3.44%
|
1/7/2019
|
$94.68
|
PP = $98.31
|
|
MB = $103.23
|
Most Recent Note - 3/13/2019 12:36:37 PM
G - Posted 4 consecutive gains with light or average volume, challenging its all-time high, extended from any sound base. Prior high ($98.21) and 50 DMA line ($99.84) define near-term support to watch on pullbacks. Fundamentals remain strong.
>>> FEATURED STOCK ARTICLE : Pullback on Higher Volume After Recent Gains With Less Volume - 3/4/2019 |
View all notes |
Set NEW NOTE alert |
Company Profile |
SEC
News |
Chart |
Request a new note
C
A
S
I |
GLOB
-
NYSE
Globant SA
Computer-Tech Services
|
$71.58
|
+1.29
1.84% |
$72.36
|
294,669
133.33% of 50 DAV
50 DAV is 221,000
|
$74.00
-3.27%
|
2/15/2019
|
$69.35
|
PP = $70.00
|
|
MB = $73.50
|
Most Recent Note - 3/13/2019 7:15:52 PM
Y - Posted a solid gain today with +33% above average volume. Recently sputtering since rallying from an advanced "3-weeks tight" base. Prior low ($65.73 on 2/08/19) defines near-term support above its 50 DMA line ($66.13).
>>> FEATURED STOCK ARTICLE : Volume-Driven Gain From Advanced "3-Weeks Tight" Base - 2/15/2019 |
View all notes |
Set NEW NOTE alert |
Company Profile |
SEC
News |
Chart |
Request a new note
C
A
S
I |
Symbol/Exchange
Company Name
Industry Group |
PRICE |
CHANGE
(%Change) |
Day High |
Volume
(% DAV)
(% 50 day avg vol) |
52 Wk Hi
% From Hi |
Featured
Date |
Price
Featured |
Pivot Featured |
|
Max Buy |
TTD
-
NASDAQ
The Trade Desk Inc Cl A
Comml Svcs-Advertising
|
$205.19
|
-2.61
-1.26% |
$209.23
|
1,188,381
86.74% of 50 DAV
50 DAV is 1,370,000
|
$208.58
-1.63%
|
2/6/2019
|
$148.65
|
PP = $149.00
|
|
MB = $156.45
|
Most Recent Note - 3/11/2019 12:29:02 PM
G - Hitting a new all-time high today after a brief consolidation. Prior high ($161) defines initial support to watch. Bullish action came after it recently reported earnings +102% on +56% sales revenues for the Dec '18 quarter.
>>> FEATURED STOCK ARTICLE : Near High After Third Consecutive Gain with Light Volume - 2/12/2019 |
View all notes |
Set NEW NOTE alert |
Company Profile |
SEC
News |
Chart |
Request a new note
C
A
S
I |