You are not logged in.
This means you
CAN ONLY VIEW reports that were published prior to Friday, February 23, 2024.
You
MUST UPGRADE YOUR MEMBERSHIP if you want to see any current reports.
AFTER MARKET UPDATE - FRIDAY, MARCH 11TH, 2022
Previous After Market Report Next After Market Report >>>
|
|
|
|
DOW |
-229.88 |
32,944.19 |
-0.69% |
|
Volume |
1,029,560,809 |
+0% |
|
Volume |
5,213,385,400 |
+5% |
|
NASDAQ |
-286.15 |
12,843.81 |
-2.18% |
|
Advancers |
825 |
26% |
|
Advancers |
1,313 |
30% |
|
S&P 500 |
-55.21 |
4,204.31 |
-1.30% |
|
Decliners |
2,338 |
74% |
|
Decliners |
3,106 |
70% |
|
Russell 2000 |
-32.00 |
1,979.67 |
-1.59% |
|
52 Wk Highs |
58 |
|
|
52 Wk Highs |
51 |
|
|
S&P 600 |
-14.90 |
1,284.70 |
-1.15% |
|
52 Wk Lows |
338 |
|
|
52 Wk Lows |
444 |
|
|
The major averages are in a continuing market correction (M criteria) and sputtering near lows for the year. Followers of the fact-based investment system know to patiently watch for a solid follow-through day to confirm a new uptrend before any new buying efforts may be justified.
|
 |
Major Indices Fall as Market Correction Continues
Kenneth J. Gruneisen - Passed the CAN SLIM® Master's Exam
The Dow lost 229 points, posting a fifth consecutive weekly decline (-2%), which marked its longest losing streak since May 2019. The S&P 500 fell 1.3%, ending the week 2.9% lower, while the Nasdaq Composite’s 2.2% slide brought its weekly drop to 3.5%. Volume totals reported were slightly higher than the prior session on the NYSE and on the Nasdaq exchange. Breadth was negative as decliners led advancers by almost a 3-1 margin on the NYSE and 5-2 on the Nasdaq exchange. There were 25 high-ranked companies from the Leaders List that hit new 52-week highs and were listed on the BreakOuts Page, versus 10 on the prior session. New 52-week lows totals grew and outnumbered new 52-week highs totals on the NYSE and on the Nasdaq exchange. The market averages (M criteria) are in a "correction" and disciplined investors are reminded to reduce exposure and raise cash.
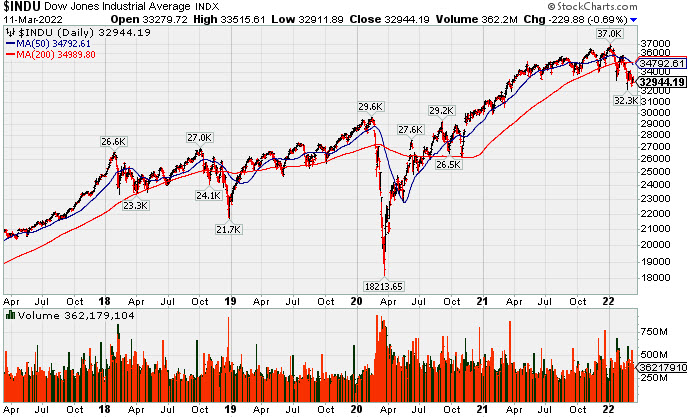
 PICTURED: The 5-year graph of the Dow Jones Industrial Average shows the decisive slump below its 50-day and 200-day moving average (DMA) lines. It closed -10.84% off its record high hit on 1/05/22.
U.S. stocks finished lower on Friday to cap the worst week since January. Mixed geopolitical headlines kept uncertainty elevated. Russian President Putin stated that he saw “certain positive shifts” in high level talks with top Ukrainian officials. However, the comment contradicted remarks from Ukraine’s foreign minister, while reports indicated that Russia’s attacks on the nation were intensifying. Meanwhile, the U.S. joined its allies in ending normal trade relations with Moscow.
On the data front, a preliminary reading from the University of Michigan revealed consumer sentiment deteriorated more than expected in March, still at the lowest point since October 2011. According to the survey, one-year inflation expectations jumped to 5.4%, the highest level since 1981. The Treasury yield curve flattened ahead of next week’s Federal Reserve policy meeting. The yield on the 10-year note rose one basis point (0.01%) to 2.00%, capping a 26-basis point (0.26%) weekly increase. In commodities, West Texas Intermediate crude gained 3% to $109.22/barrel, but posted its worst week since November (-5.7%). A gauge of the U.S. dollar ascended to its strongest level since July 2020.
All 11 S&P 500 sectors closed in negative territory, with growth-related shares leading the downturn. In stock news, Oracle Corp. (ORCL -1.53%) after issuing positive forward guidance. Elsewhere, DocuSign Inc. (DOCU -20.10%) fell on a disappointing outlook, while Rivian Automotive Inc. (RIVN -7.56%) fell following a wider-than-anticipated loss. |
 Kenneth J. Gruneisen started out as a licensed stockbroker in August 1987, a couple of months prior to the historic stock market crash that took the Dow Jones Industrial Average down -22.6% in a single day. He has published daily fact-based fundamental and technical analysis on high-ranked stocks online for two decades. Through FACTBASEDINVESTING.COM, Kenneth provides educational articles, news, market commentary, and other information regarding proven investment systems that work in good times and bad.
Comments contained in the body of this report are technical opinions only and are not necessarily those of Gruneisen Growth Corp. The material herein has been obtained from sources believed to be reliable and accurate, however, its accuracy and completeness cannot be guaranteed. Our firm, employees, and customers may effect transactions, including transactions contrary to any recommendation herein, or have positions in the securities mentioned herein or options with respect thereto. Any recommendation contained in this report may not be suitable for all investors and it is not to be deemed an offer or solicitation on our part with respect to the purchase or sale of any securities. |
|
 |
Financial, Retail, Tech, and Commodity-Linked Groups Fell
Kenneth J. Gruneisen - Passed the CAN SLIM® Master's Exam
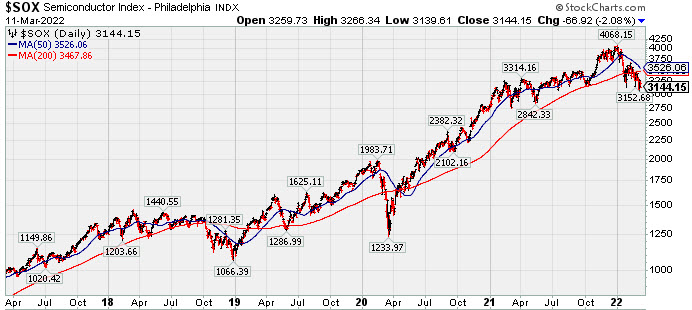
The Broker/Dealer Index ($XBD -1.38%), Bank Index ($BKX -1.11%), and Retail Index ($RLX -1.11%) lost ground on Friday. The tech sector saw unanimous losses from the Semiconductor Index ($SOX -2.08%), Biotech Index ($BTK -2.30%), and Networking Index ($NWX -1.83%). The Oil Services Index ($OSX -2.12%), Integrated Oil Index ($XOI -1.12%), and Gold & Silver Index ($XAU -1.19%) each ended lower, rounding out the widely negative session. PICTURED: The 5-year graph of the Semiconductor Index ($SOX -2.08%) shows it slumping below its 50-day and 200-day moving average lines and closing -22.7% below its record peak hit on January 4, 2022.
| Oil Services |
$OSX |
80.43 |
-1.74 |
-2.12% |
+52.56% |
| Integrated Oil |
$XOI |
1,514.67 |
-17.18 |
-1.12% |
+28.56% |
| Semiconductor |
$SOX |
3,144.15 |
-66.92 |
-2.08% |
-20.32% |
| Networking |
$NWX |
827.91 |
-15.41 |
-1.83% |
-14.74% |
| Broker/Dealer |
$XBD |
438.92 |
-6.15 |
-1.38% |
-9.85% |
| Retail |
$RLX |
3,584.01 |
-40.25 |
-1.11% |
-15.20% |
| Gold & Silver |
$XAU |
158.73 |
-1.90 |
-1.19% |
+19.84% |
| Bank |
$BKX |
122.66 |
-1.38 |
-1.11% |
-7.23% |
| Biotech |
$BTK |
4,807.66 |
-113.31 |
-2.30% |
-12.88% |
|
|
|
 |
Featured Stocks
Kenneth J. Gruneisen - Passed the CAN SLIM® Master's Exam
|
|
|
Color Codes Explained :
Y - Better candidates highlighted by our
staff of experts.
G - Previously featured
in past reports as yellow but may no longer be buyable under the
guidelines.
***Last / Change / Volume data in this table is the closing quote data***
|
|
|
THESE ARE NOT BUY RECOMMENDATIONS!
Comments contained in the body of this report are technical
opinions only. The material herein has been obtained
from sources believed to be reliable and accurate, however,
its accuracy and completeness cannot be guaranteed.
This site is not an investment advisor, hence it does
not endorse or recommend any securities or other investments.
Any recommendation contained in this report may not
be suitable for all investors and it is not to be deemed
an offer or solicitation on our part with respect to
the purchase or sale of any securities. All trademarks,
service marks and trade names appearing in this report
are the property of their respective owners, and are
likewise used for identification purposes only.
This report is a service available
only to active Paid Premium Members.
You may opt-out of receiving report notifications
at any time. Questions or comments may be submitted
by writing to Premium Membership Services 665 S.E. 10 Street, Suite 201 Deerfield Beach, FL 33441-5634 or by calling 1-800-965-8307
or 954-785-1121.
|
|
|