You are not logged in.
This means you
CAN ONLY VIEW reports that were published prior to Sunday, February 25, 2024.
You
MUST UPGRADE YOUR MEMBERSHIP if you want to see any current reports.
AFTER MARKET UPDATE - THURSDAY, MARCH 10TH, 2022
Previous After Market Report Next After Market Report >>>
|
|
|
|
DOW |
-112.18 |
33,174.07 |
-0.34% |
|
Volume |
1,025,718,554 |
-14% |
|
Volume |
4,975,740,200 |
-7% |
|
NASDAQ |
-125.58 |
13,129.96 |
-0.95% |
|
Advancers |
1,306 |
41% |
|
Advancers |
1,744 |
40% |
|
S&P 500 |
-18.36 |
4,259.52 |
-0.43% |
|
Decliners |
1,883 |
59% |
|
Decliners |
2,658 |
60% |
|
Russell 2000 |
-4.62 |
2,011.67 |
-0.23% |
|
52 Wk Highs |
44 |
|
|
52 Wk Highs |
26 |
|
|
S&P 600 |
-1.63 |
1,299.60 |
-0.13% |
|
52 Wk Lows |
241 |
|
|
52 Wk Lows |
313 |
|
|
The major averages are in a continuing market correction (M criteria) and sputtering near lows for the year. Followers of the fact-based investment system know to patiently watch for a solid follow-through day to confirm a new uptrend before any new buying efforts may be justified.
|
 |
Leadership Remains Thin as Major Indices Fall With Lighter Volume
Kenneth J. Gruneisen - Passed the CAN SLIM® Master's Exam
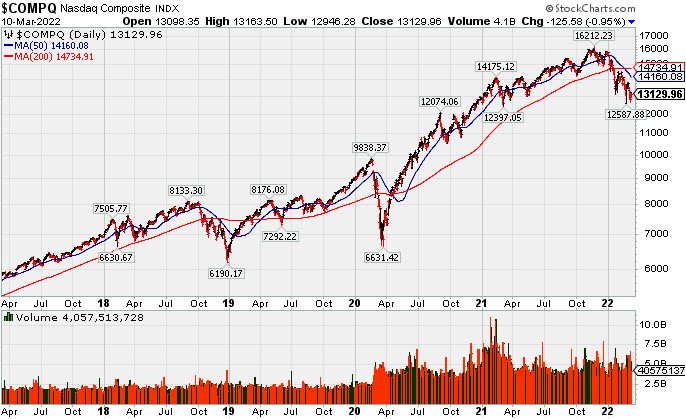
The Dow lost 112 points, while the S&P 500 fell 0.4% on the heels of its best day since June 2020. The Nasdaq Composite slid 1%. Volume totals reported were lighter than the prior session on the NYSE and on the Nasdaq exchange, indicative of less institutional selling pressure. Breadth was negative as decliners led advancers by a 3-2 margin on the NYSE and 5-3 on the Nasdaq exchange. Leadership remained thin as there were 10 high-ranked companies from the Leaders List that hit new 52-week highs and were listed on the BreakOuts Page, versus 6 on the prior session. New 52-week lows totals grew and outnumbered new 52-week highs totals on the NYSE and on the Nasdaq exchange. The market averages (M criteria) are in a "correction" and disciplined investors are reminded to reduce exposure and raise cash.
 PICTURED: The 5-year graph of the Nasdaq Composite Index shows the decisive slump below its 50-day and 200-day moving average (DMA) lines. It closed -19% off its record high hit on 11/22/21.
U.S. stocks finished lower on Thursday as investors assessed a key reading of U.S. inflation and continued to monitor geopolitical developments. The latest updates indicated that talks between top Russian and Ukrainian officials failed to result in any progress on key issues. Meanwhile, the European Central Bank unexpectedly opted to dial back its asset purchases at a faster pace in a perceived hawkish turn.
On the data front, the Consumer Price Index (CPI) climbed 7.9% year-over-year in February, accelerating to a fresh 40-year high. The reading was in-line with consensus estimates, though the full impact of the most recent rally in oil and food prices from Russia’s invasion of Ukraine will likely be captured in next month’s report. Separately, first-time unemployment claims came in at 227,000 in the week ending March 5, modestly above the prior 216,000 figure but still reflecting a tight labor market. Treasuries weakened, with the yield on the 10-year note up five basis points (0.05%) to 1.99%, while the yield on the 30-year bond spiked seven basis points (0.07%) to 2.37%, its highest level since May 2021. In commodities, West Texas Intermediate crude lost 2.2% to $106.26/barrel.
Six of 11 S&P 500 sectors finished in negative territory, with Technology stock lagging. In corporate news, Amazon.com Inc. (AMZN +5.41%) rose after disclosing a 20-for-1 stock split and authorizing a $10 billion share-buyback plan. Crowdstrike Holdings Inc. (CRWD +12.5%) rose after providing positive forward guidance following a better-than-expected quarter. |
 Kenneth J. Gruneisen started out as a licensed stockbroker in August 1987, a couple of months prior to the historic stock market crash that took the Dow Jones Industrial Average down -22.6% in a single day. He has published daily fact-based fundamental and technical analysis on high-ranked stocks online for two decades. Through FACTBASEDINVESTING.COM, Kenneth provides educational articles, news, market commentary, and other information regarding proven investment systems that work in good times and bad.
Comments contained in the body of this report are technical opinions only and are not necessarily those of Gruneisen Growth Corp. The material herein has been obtained from sources believed to be reliable and accurate, however, its accuracy and completeness cannot be guaranteed. Our firm, employees, and customers may effect transactions, including transactions contrary to any recommendation herein, or have positions in the securities mentioned herein or options with respect thereto. Any recommendation contained in this report may not be suitable for all investors and it is not to be deemed an offer or solicitation on our part with respect to the purchase or sale of any securities. |
|
 |
Retail Index and Commodity-Linked Groups Rose
Kenneth J. Gruneisen - Passed the CAN SLIM® Master's Exam
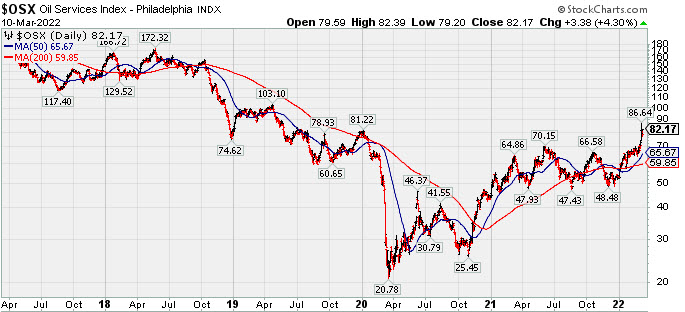
The Retail Index ($RLX +2.80%) posted a solid gain but much of the gain was attributed to Amazon (AMZN). Weak financials created a drag on the major averages as the Broker/Dealer Index ($XBD -0.94%) and Bank Index ($BKX -1.14%) lost ground. The tech sector also had a negative bias as the Semiconductor Index ($SOX -2.17%), Networking Index ($NWX -1.12%), and Biotech Index ($BTK -1.01%) suffered unanimous losses. Meanwhile, commodity-linked groups had a positive bias as the Oil Services Index ($OSX +4.30%), and Integrated Oil Index ($XOI +2.49%) both outpaced the Gold & Silver Index ($XAU +1.96%). PICTURED: The 5-year graph of the Oil Services Index ($OSX +4.30%) shows its recent rally to 2022 highs, up more than +70% from below its 50-day and 200-day moving average lines in late 2021. It also shows the bottom in March of 2020 after the Oil Services Index had been slumping for several years.
| Oil Services |
$OSX |
82.17 |
+3.38 |
+4.30% |
+55.86% |
| Integrated Oil |
$XOI |
1,531.85 |
+37.15 |
+2.49% |
+30.02% |
| Semiconductor |
$SOX |
3,211.07 |
-71.11 |
-2.17% |
-18.63% |
| Networking |
$NWX |
843.32 |
-9.58 |
-1.12% |
-13.16% |
| Broker/Dealer |
$XBD |
445.06 |
-4.21 |
-0.94% |
-8.58% |
| Retail |
$RLX |
3,624.26 |
+98.81 |
+2.80% |
-14.25% |
| Gold & Silver |
$XAU |
160.63 |
+3.09 |
+1.96% |
+21.28% |
| Bank |
$BKX |
124.03 |
-1.43 |
-1.14% |
-6.19% |
| Biotech |
$BTK |
4,920.97 |
-50.42 |
-1.01% |
-10.83% |
|
|
|
 |
Featured Stocks
Kenneth J. Gruneisen - Passed the CAN SLIM® Master's Exam
|
|
|
Color Codes Explained :
Y - Better candidates highlighted by our
staff of experts.
G - Previously featured
in past reports as yellow but may no longer be buyable under the
guidelines.
***Last / Change / Volume data in this table is the closing quote data***
|
|
|
THESE ARE NOT BUY RECOMMENDATIONS!
Comments contained in the body of this report are technical
opinions only. The material herein has been obtained
from sources believed to be reliable and accurate, however,
its accuracy and completeness cannot be guaranteed.
This site is not an investment advisor, hence it does
not endorse or recommend any securities or other investments.
Any recommendation contained in this report may not
be suitable for all investors and it is not to be deemed
an offer or solicitation on our part with respect to
the purchase or sale of any securities. All trademarks,
service marks and trade names appearing in this report
are the property of their respective owners, and are
likewise used for identification purposes only.
This report is a service available
only to active Paid Premium Members.
You may opt-out of receiving report notifications
at any time. Questions or comments may be submitted
by writing to Premium Membership Services 665 S.E. 10 Street, Suite 201 Deerfield Beach, FL 33441-5634 or by calling 1-800-965-8307
or 954-785-1121.
|
|
|