You are not logged in.
This means you
CAN ONLY VIEW reports that were published prior to Sunday, February 25, 2024.
You
MUST UPGRADE YOUR MEMBERSHIP if you want to see any current reports.
AFTER MARKET UPDATE - MONDAY, MARCH 9TH, 2020
Previous After Market Report Next After Market Report >>>
|
|
|
|
DOW |
-2,013.76 |
23,851.02 |
-7.79% |
|
Volume |
2,096,986,590 |
+30% |
|
Volume |
4,488,880,600 |
+5% |
|
NASDAQ |
-624.94 |
7,950.68 |
-7.29% |
|
Advancers |
70 |
2% |
|
Advancers |
180 |
5% |
|
S&P 500 |
-225.81 |
2,746.56 |
-7.60% |
|
Decliners |
2,833 |
98% |
|
Decliners |
3,121 |
95% |
|
Russell 2000 |
-135.79 |
1,313.43 |
-9.37% |
|
52 Wk Highs |
15 |
|
|
52 Wk Highs |
53 |
|
|
S&P 600 |
-83.67 |
783.53 |
-9.65% |
|
52 Wk Lows |
1,620 |
|
|
52 Wk Lows |
1,406 |
|
|
During market corrections it is especially important to reduce exposure, preserve your capital, and just be patient. Be safe! Historic studies have shown that the biggest up sessions have occurred during market corrections and bear markets.
Disciplined investors know to wait until a new confirmed rally marked by a solid follow-through day. The bold portion of the daily market commentary will note when that happens. For any clarification or additional help applying the fact-based investment system, we invite members to call, or contact us via the inquiry form.
|
 |
Market Correction Intensifies as Panic Leads to Capitulation
Kenneth J. Gruneisen - Passed the CAN SLIM® Master's Exam
After being briefly halted for a 7% drop shortly after the open, the S&P 500 closed 7.6% lower. On the 11th anniversary of the current bull market, the benchmark finished just 38 points from dipping into bear market territory. The Dow fell 2013 points, its largest ever point-decline, while the Nasdaq Composite slumped 7.3%. Breadth was clearly negative as decliners led advancers by a 40-1 margin on the NYSE and 17-1 on the Nasdaq exchange. The reported volume totals were higher than the prior session totals on the NYSE and on the Nasdaq exchange, revealing more intense distributional selling pressure from the institutional crowd. Leadership evaporated as there were 2 high-ranked companies from the Leaders List that hit a new 52-week high and were listed on the BreakOuts Page, versus 4 on the prior session. New 52-week lows totals swelled greatly and easily outnumbered new 52-week highs on the NYSE and on the Nasdaq exchange. The major indices' (M criteria) have been in a noted "market correction". Disciplined investors know to watch for a follow-through day of gains on higher volume to confirm a new market uptrend. The Featured Stocks Page provides the most timely analysis on high-ranked leaders. Charts used courtesy of www.stockcharts.com
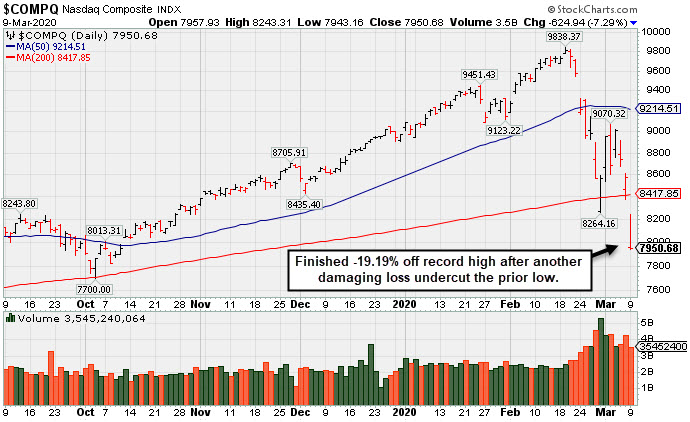
PICTURED: The Nasdaq Composite Index slumped below its 200-day moving average (DMA) line with more damaging volume-driven losses undercutting the prior low. The tech-heavy index is -19.19% off its all-time high hit on 2/19/20. Disciplined investors will watch for a follow-through day of big gains on higher volume to signal a new confirmed rally.
Global stocks experienced the worst session in more than a decade on Monday as continued coronavirus uncertainty and heightened tensions between oil producers pressured risk sentiment. All 11 S&P 500 sectors closed in negative territory. Energy stocks led decliners, sinking more than 20% as WTI crude tumbled 24.6% to $31.13/barrel, which represented the largest single-session drop since the 1991 Gulf War. The descent was sparked after Saudi Arabia signaled plans to boost production after Russia failed to agree to further OPEC+ output curbs. Amid the oil retreat, Exxon Mobil (XOM -12.22%) and Halliburton (HAL -37.64%), respectively. Bank stocks were also under pressure, with the Financial sector falling 10.9% for its worst session since 2011.
S&P 500 trading volume was roughly 30% above its 10-day moving average, while the CBOE Volatility Index (VIX) reached a 12-year high. U.S. Treasuries once again surged as investors sought perceived safe haven assets. The yield on the 10-year Treasury note fell 21 basis points to 0.57%, while the yield on the 30-year bond briefly dipped below 1% before finishing 30 basis points lower at 1.03%. Fed-fund futures tracked by the CME Group are now pricing in a further 0.75% cut in interest rates at the March FOMC meeting on March 18th. |
 Kenneth J. Gruneisen started out as a licensed stockbroker in August 1987, a couple of months prior to the historic stock market crash that took the Dow Jones Industrial Average down -22.6% in a single day. He has published daily fact-based fundamental and technical analysis on high-ranked stocks online for two decades. Through FACTBASEDINVESTING.COM, Kenneth provides educational articles, news, market commentary, and other information regarding proven investment systems that work in good times and bad.
Comments contained in the body of this report are technical opinions only and are not necessarily those of Gruneisen Growth Corp. The material herein has been obtained from sources believed to be reliable and accurate, however, its accuracy and completeness cannot be guaranteed. Our firm, employees, and customers may effect transactions, including transactions contrary to any recommendation herein, or have positions in the securities mentioned herein or options with respect thereto. Any recommendation contained in this report may not be suitable for all investors and it is not to be deemed an offer or solicitation on our part with respect to the purchase or sale of any securities. |
|
 |
Energy, Financial, Tech, and Retail Groups Suffered Large Losses
Kenneth J. Gruneisen - Passed the CAN SLIM® Master's Exam
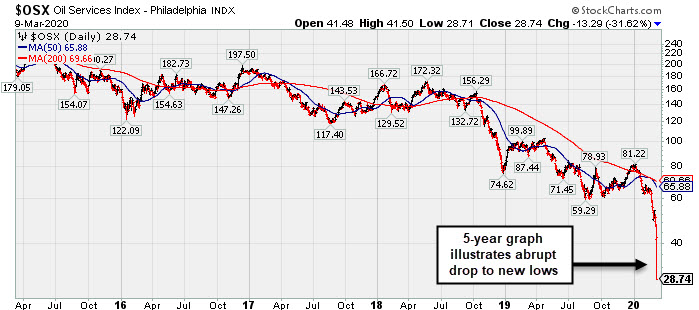
Energy-linked groups were standout decliners again as the Oil Services Index ($OSX -31.62%) and the Integrated Oil Index ($XOI -21.29%) slumped badly. The Gold & Silver Index ($XAU -8.47%) also lost considerable ground on the widely negative session. The Bank Index ($BKX -13.90%) and Broker/Dealer Index ($XBD -10.21%) were also big decliners weighing on the major indices, and the Retail Index ($RLX -5.29%) slumped. The tech sector had a clearly negative bias as the Semiconductor Index ($SOX -8.34%), Networking Index ($NWX -6.36%), and the Biotech Index ($BTK -6.22%) slumped.
PICTURED: The 5-year graph of the Oil Services Index ($OSX -31.62%) illustrates the abrupt drop today to new lows after it was already suffering badly.
| Oil Services |
$OSX |
28.74 |
-13.29 |
-31.62% |
-63.29% |
| Integrated Oil |
$XOI |
689.08 |
-184.33 |
-21.10% |
-45.76% |
| Semiconductor |
$SOX |
1,558.16 |
-141.73 |
-8.34% |
-15.76% |
| Networking |
$NWX |
456.27 |
-31.02 |
-6.37% |
-21.79% |
| Broker/Dealer |
$XBD |
228.14 |
-25.16 |
-9.93% |
-21.43% |
| Retail |
$RLX |
2,255.40 |
-126.05 |
-5.29% |
-7.92% |
| Gold & Silver |
$XAU |
94.29 |
-8.72 |
-8.47% |
-11.81% |
| Bank |
$BKX |
72.22 |
-11.66 |
-13.90% |
-36.29% |
| Biotech |
$BTK |
4,603.67 |
-304.85 |
-6.21% |
-9.15% |
|
|
|
 |
Featured Stocks
Kenneth J. Gruneisen - Passed the CAN SLIM® Master's Exam
See the Featured Stocks with most recent note below. Feel free to contact us if you have a need for any additional information. |
|
|
Color Codes Explained :
Y - Better candidates highlighted by our
staff of experts.
G - Previously featured
in past reports as yellow but may no longer be buyable under the
guidelines.
***Last / Change / Volume data in this table is the closing quote data***
Symbol/Exchange
Company Name
Industry Group |
PRICE |
CHANGE
(%Change) |
Day High |
Volume
(% DAV)
(% 50 day avg vol) |
52 Wk Hi
% From Hi |
Featured
Date |
Price
Featured |
Pivot Featured |
|
Max Buy |
 FTNT
-
NASDAQ
FTNT
-
NASDAQ
Fortinet Inc
Computer Sftwr-Security
|
$87.14
|
-12.36
-12.42% |
$97.60
|
3,876,563
280.71% of 50 DAV
50 DAV is 1,381,000
|
$121.82
-28.47%
|
12/9/2019
|
$103.85
|
PP = $106.10
|
|
MB = $111.41
|
 Most Recent Note - 3/9/2020 5:29:02 PM
Suffered another big and damaging loss with above average volume today violating its 200 DMA line ($92) and triggering a more worrisome technical sell signal. It will be dropped from the Featured Stocks list tonight.
>>> FEATURED STOCK ARTICLE : Volume Driven Losses Violated 50-Day Moving Average - 2/26/2020 |
View all notes |
Set NEW NOTE alert |
Company Profile |
SEC
News |
Chart |
Request a new note
C
A
S
I |
PAYC
-
NYSE
Paycom Software Inc
COMPUTER SOFTWARE and SERVICES - Application Software
|
$240.84
|
-26.87
-10.04% |
$255.86
|
1,356,596
135.52% of 50 DAV
50 DAV is 1,001,000
|
$342.00
-29.58%
|
11/20/2019
|
$252.97
|
PP = $259.81
|
|
MB = $272.80
|
Most Recent Note - 3/9/2020 5:30:41 PM
Gapped down today for another damaging loss violating its 200 DMA line ($247), triggering a more worrisome technical sell signal. It will be dropped from the Featured Stocks list tonight.
>>> FEATURED STOCK ARTICLE : Sputtering Below 50-Day Moving Average - 3/3/2020 |
View all notes |
Set NEW NOTE alert |
Company Profile |
SEC
News |
Chart |
Request a new note
C
A
S
I |
TEAM
-
NASDAQ
Atlassian Corp Plc Cl A
Comp Sftwr-Spec Enterprs
|
$133.00
|
-11.36
-7.87% |
$136.00
|
3,106,380
183.81% of 50 DAV
50 DAV is 1,690,000
|
$156.12
-14.81%
|
1/24/2020
|
$144.66
|
PP = $140.49
|
|
MB = $147.51
|
Most Recent Note - 3/9/2020 5:34:47 PM
G - Gapped down today with a damaging volume-driven loss is testing its 200 DMA line ($132) amid widespread market weakness (M criteria). A rebound above its 50 DMA line ($140.87) is needed for its outlook to improve.
>>> FEATURED STOCK ARTICLE : Found Support at 50-Day Average During Recent Consolidation - 3/4/2020 |
View all notes |
Set NEW NOTE alert |
Company Profile |
SEC
News |
Chart |
Request a new note
C
A
S
I |
STNE
-
NASDAQ
Stoneco Ltd Cl A
Finance-CrdtCard/PmtPr
|
$36.03
|
-3.97
-9.93% |
$37.09
|
5,210,963
241.70% of 50 DAV
50 DAV is 2,156,000
|
$46.69
-22.83%
|
1/22/2020
|
$43.94
|
PP = $45.72
|
|
MB = $48.01
|
Most Recent Note - 3/9/2020 5:33:27 PM
It will be dropped from the Featured Stocks list tonight. Tested support at its 200 DMA line ($35.66) with a damaging volume-driven loss today. A rebound above its 50 DMA line ($41.90) is needed for its outlook to improve. The worrisome market correction (M criteria) is cause for concern.
>>> FEATURED STOCK ARTICLE : Volume-Driven Gain Above 50-Day Moving Average - 3/2/2020 |
View all notes |
Set NEW NOTE alert |
Company Profile |
SEC
News |
Chart |
Request a new note
C
A
S
I |
DAVA
-
NYSE
Endava Plc Cl A Ads
Computer-Tech Services
|
$45.64
|
-4.79
-9.50% |
$48.47
|
697,665
512.99% of 50 DAV
50 DAV is 136,000
|
$56.76
-19.59%
|
2/13/2020
|
$53.71
|
PP = $49.86
|
|
MB = $52.35
|
Most Recent Note - 3/9/2020 5:27:08 PM
G - Gapped down today decisively violating its prior high in the $49 area and its 50 DMA line ($48.91) with a damaging volume-driven loss triggering a technical sell signal. Only a prompt rebound would help its outlook improve.
>>> FEATURED STOCK ARTICLE : Breakout Gain Backed By +462% Above Average Volme - 2/13/2020 |
View all notes |
Set NEW NOTE alert |
Company Profile |
SEC
News |
Chart |
Request a new note
C
A
S
I |
Symbol/Exchange
Company Name
Industry Group |
PRICE |
CHANGE
(%Change) |
Day High |
Volume
(% DAV)
(% 50 day avg vol) |
52 Wk Hi
% From Hi |
Featured
Date |
Price
Featured |
Pivot Featured |
|
Max Buy |
|
|
|
THESE ARE NOT BUY RECOMMENDATIONS!
Comments contained in the body of this report are technical
opinions only. The material herein has been obtained
from sources believed to be reliable and accurate, however,
its accuracy and completeness cannot be guaranteed.
This site is not an investment advisor, hence it does
not endorse or recommend any securities or other investments.
Any recommendation contained in this report may not
be suitable for all investors and it is not to be deemed
an offer or solicitation on our part with respect to
the purchase or sale of any securities. All trademarks,
service marks and trade names appearing in this report
are the property of their respective owners, and are
likewise used for identification purposes only.
This report is a service available
only to active Paid Premium Members.
You may opt-out of receiving report notifications
at any time. Questions or comments may be submitted
by writing to Premium Membership Services 665 S.E. 10 Street, Suite 201 Deerfield Beach, FL 33441-5634 or by calling 1-800-965-8307
or 954-785-1121.
|
|
|