You are not logged in.
This means you
CAN ONLY VIEW reports that were published prior to Sunday, February 25, 2024.
You
MUST UPGRADE YOUR MEMBERSHIP if you want to see any current reports.
AFTER MARKET UPDATE - MONDAY, MARCH 7TH, 2022
Previous After Market Report Next After Market Report >>>
|
|
|
|
DOW |
-797.42 |
32,817.38 |
-2.37% |
|
Volume |
1,394,821,946 |
+18% |
|
Volume |
6,116,539,300 |
+16% |
|
NASDAQ |
-482.48 |
12,830.96 |
-3.62% |
|
Advancers |
658 |
20% |
|
Advancers |
1,209 |
30% |
|
S&P 500 |
-127.78 |
4,201.09 |
-2.95% |
|
Decliners |
2,554 |
79% |
|
Decliners |
2,758 |
70% |
|
Russell 2000 |
-49.57 |
1,951.33 |
-2.48% |
|
52 Wk Highs |
186 |
|
|
52 Wk Highs |
75 |
|
|
S&P 600 |
-29.58 |
1,269.49 |
-2.28% |
|
52 Wk Lows |
486 |
|
|
52 Wk Lows |
805 |
|
|
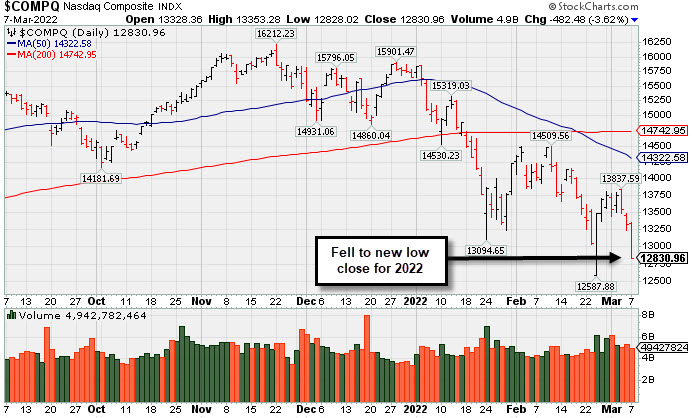
The major averages signaled a continuing market correction (M criteria) with a plunge on Monday to each close at new lows for the year. Followers of the fact-based investment system know to patiently watch for a solid follow-through day to confirm a new uptrend before any new buying efforts may be justified.
|
 |
Major Indices Unanimously Fell to New Low Closes for 2022
Kenneth J. Gruneisen - Passed the CAN SLIM® Master's Exam
The Dow shed 797 points, while the S&P 500 fell 3% and marked its worst session since October 2020. Both benchmarks ended in correction territory (defined as a 10% decline from a recent record). The Nasdaq Composite retreated 3.6%, sinking into bear market territory (defined as a 20% drop from a recent peak) amid weakness in growth-related shares. Volume totals reported were higher than the prior session on the NYSE and on the Nasdaq exchange, indicative of an increase in institutional selling termed "distribution". Breadth was clearly negative as decliners led advancers by a 4-1 margin on the NYSE and more than 3-1 on the Nasdaq exchange. There were 40 high-ranked companies from the Leaders List that hit new 52-week highs and were listed on the BreakOuts Page, versus 35 on the prior session. New 52-week lows totals expanded and outnumbered new 52-week highs on the NYSE and on the Nasdaq exchange. The market averages (M criteria) are in a "correction" and disciplined investors are reminded to reduce exposure and raise cash.
 PICTURED: The Nasdaq Composite Index fell for a 3rd consecutive loss and closed at a new 2022 low.
U.S. stocks finished firmly lower Monday as rising commodity prices stoked concerns surrounding inflation and global economic growth. Overseas, the German DAX confirmed a bear market for the first time since 2020. Treasuries weakened, with the yield on the 10-year note up five basis points (0.05%) to 1.79%, while a measure of 10-year inflationary expectations hit an all-time high.
West Texas Intermediate (WTI) crude added 3.6% to $119.84/barrel after earlier touching $130.50/barrel, a peak not seen since July 2008. Crude prices climbed amid reports that the U.S. and its allies were contemplating a formal ban on Russian oil and natural gas imports, but pared earlier gains as European Union governments were divided on the issue. Wheat soared to a record amid supply constraints, as did various metals. COMEX gold topped $2,000/ounce for the first time since August 2020.
Nine of 11 S&P 500 sectors closed in negative territory, with Consumer Discretionary shares leading the decline. PVH Corp (PVH -15.37%) and Ralph Lauren Corp (RL -12.23%) were among the notable laggards following an analyst downgrade due to outsized exposure to Europe. Offering a bright spot for retailers was Bed Bath & Beyond Inc., (BBBY +34.18%) rose after activist investor Ryan Cohen reported a nearly 10% stake in the company. |
 Kenneth J. Gruneisen started out as a licensed stockbroker in August 1987, a couple of months prior to the historic stock market crash that took the Dow Jones Industrial Average down -22.6% in a single day. He has published daily fact-based fundamental and technical analysis on high-ranked stocks online for two decades. Through FACTBASEDINVESTING.COM, Kenneth provides educational articles, news, market commentary, and other information regarding proven investment systems that work in good times and bad.
Comments contained in the body of this report are technical opinions only and are not necessarily those of Gruneisen Growth Corp. The material herein has been obtained from sources believed to be reliable and accurate, however, its accuracy and completeness cannot be guaranteed. Our firm, employees, and customers may effect transactions, including transactions contrary to any recommendation herein, or have positions in the securities mentioned herein or options with respect thereto. Any recommendation contained in this report may not be suitable for all investors and it is not to be deemed an offer or solicitation on our part with respect to the purchase or sale of any securities. |
|
 |
Financial, Retail, and Tech Indexes Fell
Kenneth J. Gruneisen - Passed the CAN SLIM® Master's Exam
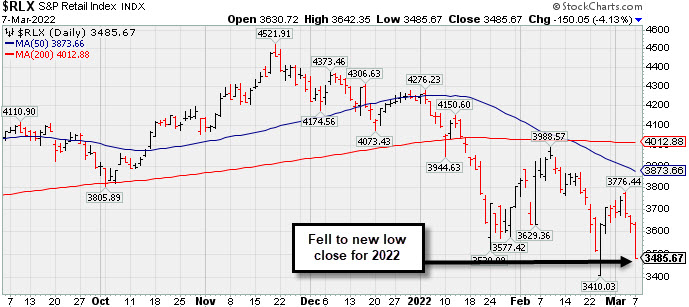
The Broker/Dealer Index ($XBD -4.60%), Bank Index ($BKX -4.62%), and Retail Index ($RLX -4.13%) each fell more than -4% and created a big drag on the major market averages. The Semiconductor Index ($SOX -4.91%) led the tech sector lower while the Networking Index ($NWX -3.05%) and Biotech Index ($BTK -1.47%) also fell. The Oil Services Index ($OSX +8.59%) posted a standout gain while the Integrated Oil Index ($XOI -0.05%) finished flat. The Gold & Silver Index ($XAU +1.68%) also gained ground. PICTURED: The Retail Index ($RLX -4.13%) fell to a new low close for 2022. Weakness in the Retail index bodes poorly for the market outlook because consumer spending accounts for about 2/3 of the US economy.
| Oil Services |
$OSX |
79.54 |
+6.29 |
+8.59% |
+50.87% |
| Integrated Oil |
$XOI |
1,519.49 |
-0.83 |
-0.05% |
+28.97% |
| Semiconductor |
$SOX |
3,098.93 |
-159.99 |
-4.91% |
-21.47% |
| Networking |
$NWX |
835.40 |
-26.31 |
-3.05% |
-13.97% |
| Broker/Dealer |
$XBD |
432.79 |
-20.87 |
-4.60% |
-11.11% |
| Retail |
$RLX |
3,485.67 |
-150.05 |
-4.13% |
-17.53% |
| Gold & Silver |
$XAU |
157.65 |
+2.60 |
+1.68% |
+19.03% |
| Bank |
$BKX |
119.70 |
-5.80 |
-4.62% |
-9.47% |
| Biotech |
$BTK |
4,824.39 |
-71.85 |
-1.47% |
-12.58% |
|
|
|
 |
Featured Stocks
Kenneth J. Gruneisen - Passed the CAN SLIM® Master's Exam
|
|
|
Color Codes Explained :
Y - Better candidates highlighted by our
staff of experts.
G - Previously featured
in past reports as yellow but may no longer be buyable under the
guidelines.
***Last / Change / Volume data in this table is the closing quote data***
|
|
|
THESE ARE NOT BUY RECOMMENDATIONS!
Comments contained in the body of this report are technical
opinions only. The material herein has been obtained
from sources believed to be reliable and accurate, however,
its accuracy and completeness cannot be guaranteed.
This site is not an investment advisor, hence it does
not endorse or recommend any securities or other investments.
Any recommendation contained in this report may not
be suitable for all investors and it is not to be deemed
an offer or solicitation on our part with respect to
the purchase or sale of any securities. All trademarks,
service marks and trade names appearing in this report
are the property of their respective owners, and are
likewise used for identification purposes only.
This report is a service available
only to active Paid Premium Members.
You may opt-out of receiving report notifications
at any time. Questions or comments may be submitted
by writing to Premium Membership Services 665 S.E. 10 Street, Suite 201 Deerfield Beach, FL 33441-5634 or by calling 1-800-965-8307
or 954-785-1121.
|
|
|