You are not logged in.
This means you
CAN ONLY VIEW reports that were published prior to Tuesday, February 20, 2024.
You
MUST UPGRADE YOUR MEMBERSHIP if you want to see any current reports.
AFTER MARKET UPDATE - THURSDAY, MARCH 7TH, 2019
Previous After Market Report Next After Market Report >>>
|
|
|
|
DOW |
-200.23 |
25,473.23 |
-0.78% |
|
Volume |
921,302,350 |
+5% |
|
Volume |
2,419,455,080 |
+8% |
|
NASDAQ |
-84.46 |
7,421.46 |
-1.13% |
|
Advancers |
893 |
30% |
|
Advancers |
987 |
32% |
|
S&P 500 |
-22.52 |
2,748.93 |
-0.81% |
|
Decliners |
2,045 |
70% |
|
Decliners |
2,108 |
68% |
|
Russell 2000 |
-13.19 |
1,523.63 |
-0.86% |
|
52 Wk Highs |
71 |
|
|
52 Wk Highs |
33 |
|
|
S&P 600 |
-10.05 |
935.73 |
-1.06% |
|
52 Wk Lows |
52 |
|
|
52 Wk Lows |
68 |
|
|
 |
Leadership Thin as Nasdaq Composite Falls Below 200-Day Average
Kenneth J. Gruneisen - Passed the CAN SLIM® Master's Exam
Stocks finished lower Thursday. The Dow fell 200 points to 25,473 while the S&P 500 lost 22 points to 2,748. The Nasdaq Composite slipped 84 points to 7,421. The volume totals reported were higher than the prior session totals on the NYSE and on the Nasdaq exchange, indicative of more worrisome distributional pressure. Breadth was negative as decliners led advancers by more than a 2-1 margin on the NYSE and on the Nasdaq exchange. Leadership thinned as there were 4 high-ranked companies from the Leaders List that made a new 52-week high and were listed on the BreakOuts Page, versus the total of 11 on the prior session, and down abruptly from 47 stocks last Thursday. New 52-week highs outnumbered new 52-week lows on the NYSE, however, new lows outnumbered new highs on the Nasdaq exchange for the second consecutive session. The major indices have recently seen the previous uptrend (M criteria) come under pressure while leadership has thinned. The Featured Stocks Page provides the most timely analysis on high-ranked leaders. Charts used courtesy of www.stockcharts.com
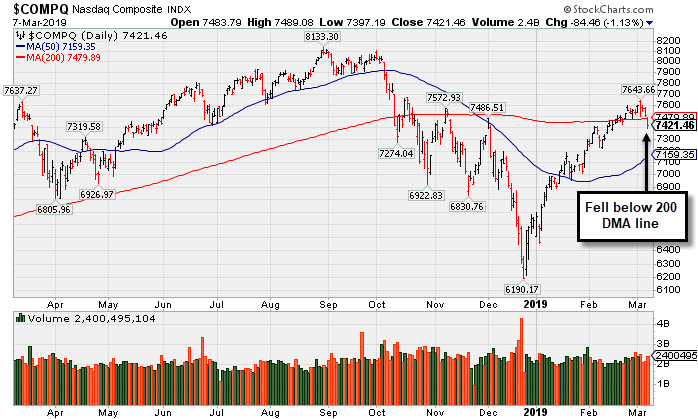
PICTURED: The Nasdaq Composite fell below its 200-day moving average (DMA) line.
U.S. equities extended losses after a disappointing central bank update renewed concerns about a global economic slowdown. At a post meeting press conference, ECB President Mario Draghi announced policymakers were reducing the Eurozone’s economic growth forecast from 1.7% to 1.1%. Separately, the European Central Bank unexpectedly announced a new fiscal stimulus plan that will begin in September and is slated to run through early 2021. On the data front, a report showed initial jobless claims declined from 226,000 to 223,000 in the prior week.
Ten of 11 S&P 500 sectors finished in negative territory with the defensive Utilities group the lone outperformer. Consumer Discretionary and Financials paced the decline as the sectors fell 1.4% and 1.1% respectively. In earnings, Kroger (KR -9.95%) sank after the grocery store chain missed analyst profit estimates and offered disappointing forward guidance. In other corporate news, Allergan (AGN +3.99%) rose after the company announced the FDA accepted its application to expand the use of its Botox drug.
Treasuries strengthened along the curve with the yield on the 10-year note falling five basis points to 2.64%. In commodities, NYMEX WTI crude added 0.6% to $56.56/barrel. COMEX gold fell 0.1% to $1,286.00/ounce as the U.S. Dollar Index jumped 0.7%. |
 Kenneth J. Gruneisen started out as a licensed stockbroker in August 1987, a couple of months prior to the historic stock market crash that took the Dow Jones Industrial Average down -22.6% in a single day. He has published daily fact-based fundamental and technical analysis on high-ranked stocks online for two decades. Through FACTBASEDINVESTING.COM, Kenneth provides educational articles, news, market commentary, and other information regarding proven investment systems that work in good times and bad.
Comments contained in the body of this report are technical opinions only and are not necessarily those of Gruneisen Growth Corp. The material herein has been obtained from sources believed to be reliable and accurate, however, its accuracy and completeness cannot be guaranteed. Our firm, employees, and customers may effect transactions, including transactions contrary to any recommendation herein, or have positions in the securities mentioned herein or options with respect thereto. Any recommendation contained in this report may not be suitable for all investors and it is not to be deemed an offer or solicitation on our part with respect to the purchase or sale of any securities. |
|
 |
Financial, Retail, Tech and Energy-Linked Groups Fell
Kenneth J. Gruneisen - Passed the CAN SLIM® Master's Exam
The Bank Index ($BKX -1.40%), Broker/Dealer Index ($XBD -1.82%), and the Retail Index ($RLX -1.72%) ended unanimously to the downside. The tech sector had a negative bias as the Biotech Index ($BTK -0.56%), Semiconductor Index ($SOX -1.10%), and the Networking Index ($NWX -1.18%) also ended lower. Commodity-linked groups were mixed as the Gold & Silver Index ($XAU +0.66%) posted a small gain, meanwhile the Oil Services Index ($OSX -1.55%) and the Integrated Oil Index ($XOI -0.84%) both ended the session lower.
Charts courtesy of www.stockcharts.com
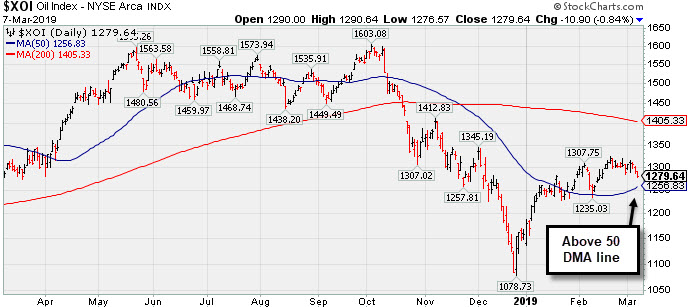 PICTURED: The Integrated Oil Index ($XOI -0.84%) is consolidating above its 50-day moving average (DMA line.
| Oil Services |
$OSX |
91.15 |
-1.44 |
-1.56% |
+13.09% |
| Integrated Oil |
$XOI |
1,279.64 |
-10.90 |
-0.84% |
+10.40% |
| Semiconductor |
$SOX |
1,319.09 |
-14.73 |
-1.10% |
+14.19% |
| Networking |
$NWX |
570.02 |
-6.78 |
-1.18% |
+16.65% |
| Broker/Dealer |
$XBD |
257.13 |
-4.77 |
-1.82% |
+8.34% |
| Retail |
$RLX |
2,120.51 |
-37.19 |
-1.72% |
+8.67% |
| Gold & Silver |
$XAU |
73.63 |
+0.48 |
+0.66% |
+4.20% |
| Bank |
$BKX |
97.25 |
-1.38 |
-1.40% |
+13.36% |
| Biotech |
$BTK |
4,883.05 |
-27.40 |
-0.56% |
+15.69% |
|
|
|
 |
Consolidating Above 50-Day Moving Average and Prior Highs
Kenneth J. Gruneisen - Passed the CAN SLIM® Master's Exam
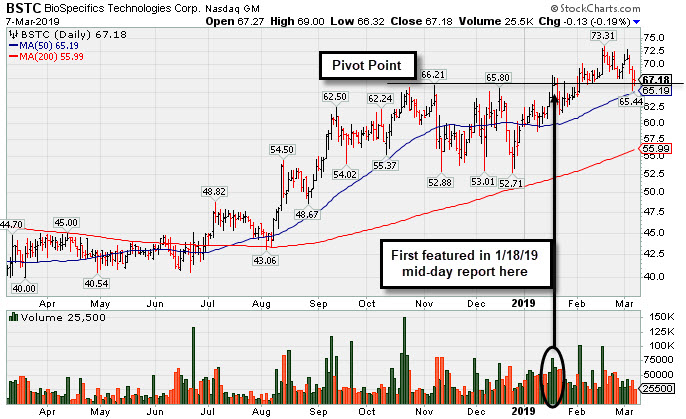
Biospecifics Technologies (BSTC -$0.13 or -0.19% to $67.18) is consolidating near prior highs and its 50-day moving average (DMA) line ($66.19) defining very important near-term support to watch. More damaging losses would raise concerns and trigger a technical sell signal.
BSTC was first highlighted in yellow with pivot point cited based on its 11/07/18 high plus 10 cents in the 1/18/19 mid-day report (read here). A big volume-driven gain 1/17/19 for a new high close was a reassuring sign of institutional accumulation clinching a technical buy signal. It was last shown in this FSU section on 2/05/19 with an annotated graph under the headline, "Reversed Into Red After Hitting a New High".
The thinly traded Biomed/Biotech firm's small supply (S criteria) of only 5.2 million shares in the public float can contribute to greater price volatility in the event of institutional buying or selling. The number of top-rated funds owning its shares rose from 171 in Mar '18 to 218 in Dec '18, a reassuring sign concerning the I criteria. Its current up/Down Volume Ratio of 1.4 is an unbiased indication its shares have been under accumulation over the past 50 days. It has an A Timeliness Rating and a C Sponsorship rating.
Keep in mind it it due to report earnings news on 3/14/19. Volume and volatility often increase near earnings news. Earnings increases have been above the +25% minimum guideline (C criteria) in the 4 latest quarterly comparisons through Sep '18. Its sales revenues growth rate has shown acceleration, but quarterly totals have been in the $7-8 million range, still rather minuscule in the context of all publicly traded companies.
Charts courtesy of www.stockcharts.com
 |
|
|
Color Codes Explained :
Y - Better candidates highlighted by our
staff of experts.
G - Previously featured
in past reports as yellow but may no longer be buyable under the
guidelines.
***Last / Change / Volume data in this table is the closing quote data***
Symbol/Exchange
Company Name
Industry Group |
PRICE |
CHANGE
(%Change) |
Day High |
Volume
(% DAV)
(% 50 day avg vol) |
52 Wk Hi
% From Hi |
Featured
Date |
Price
Featured |
Pivot Featured |
|
Max Buy |
MLR
-
NYSE
Miller Industries Inc
AUTOMOTIVE - Auto Parts
|
$33.06
|
-1.10
-3.22% |
$34.59
|
48,195
146.05% of 50 DAV
50 DAV is 33,000
|
$35.26
-6.24%
|
11/30/2018
|
$28.35
|
PP = $29.50
|
|
MB = $30.98
|
 Most Recent Note - 3/7/2019 5:22:40 PM
G - Suffered a 3rd consecutive loss today, retreating from its 52-week high. Reported earnings +17% on +13% sales revenues for the Dec '18 quarter, below the +25% minimum guideline (C criteria), raising fundamental concerns. Its 50 DMA line ($30.16) and prior highs in the $29 area define near-term support to watch.
>>> FEATURED STOCK ARTICLE : Extended From Prior Base After Impressive Streak of Gains - 3/1/2019 |
View all notes |
Set NEW NOTE alert |
Company Profile |
SEC
News |
Chart |
Request a new note
C
A
S
I |
NSP
-
NYSE
Insperity Inc
Comml Svcs-Outsourcing
|
$122.55
|
+0.42
0.34% |
$122.75
|
189,629
52.82% of 50 DAV
50 DAV is 359,000
|
$132.50
-7.51%
|
2/11/2019
|
$127.91
|
PP = $121.25
|
|
MB = $127.31
|
Most Recent Note - 3/4/2019 8:27:52 PM
Y - Quietly consolidating below its "max buy" level. Prior highs in the $119-121 area define initial support to watch on pullbacks.
>>> FEATURED STOCK ARTICLE : Big Breakaway Gap Triggered Technical Buy Signal - 2/11/2019 |
View all notes |
Set NEW NOTE alert |
Company Profile |
SEC
News |
Chart |
Request a new note
C
A
S
I |
ZBRA
-
NASDAQ
Zebra Tech Corp Cl A
COMPUTER HARDWARE - Computer Peripherals
|
$201.99
|
+0.75
0.37% |
$203.93
|
291,191
58.24% of 50 DAV
50 DAV is 500,000
|
$207.88
-2.83%
|
2/14/2019
|
$198.10
|
PP = $184.85
|
|
MB = $194.09
|
Most Recent Note - 3/5/2019 8:58:51 PM
G - Still stubbornly holding its ground in a tight range near its all-time high with volume totals cooling. Extended from the prior base. Prior highs in the $184 area define initial support to watch on pullbacks.
>>> FEATURED STOCK ARTICLE : Big Volume-Driven Gain for New High - 2/14/2019 |
View all notes |
Set NEW NOTE alert |
Company Profile |
SEC
News |
Chart |
Request a new note
C
A
S
I |
SPSC
-
NASDAQ
S P S Commerce Inc
COMPUTER SOFTWARE and SERVICES - Application Software
|
$105.54
|
+0.14
0.13% |
$106.77
|
125,497
76.06% of 50 DAV
50 DAV is 165,000
|
$113.31
-6.86%
|
2/13/2019
|
$104.30
|
PP = $100.78
|
|
MB = $105.82
|
Most Recent Note - 3/6/2019 6:01:26 PM
Y - Color code is changed to yellow after pulling back below its "max buy" level with today's loss on light volume. Prior highs in the $100 area define initial support to watch.
>>> FEATURED STOCK ARTICLE : Gap Up and Big Volume Driven Gain for New High - 2/13/2019 |
View all notes |
Set NEW NOTE alert |
Company Profile |
SEC
News |
Chart |
Request a new note
C
A
S
I |
SSNC
-
NASDAQ
S S & C Technologies
COMPUTER SOFTWARE and SERVICES - Application Software
|
$60.96
|
-0.67
-1.09% |
$61.70
|
1,437,993
76.49% of 50 DAV
50 DAV is 1,880,000
|
$64.36
-5.28%
|
2/15/2019
|
$59.73
|
PP = $61.07
|
|
MB = $64.12
|
Most Recent Note - 3/6/2019 6:04:30 PM
Y - Pulled back today for a small loss with higher volume. Holding its ground since a 3/01/19 gain above its pivot point backed by +49% above average volume triggered a technical buy signal.
>>> FEATURED STOCK ARTICLE : Volume-Driven Gain for New High Close - 2/19/2019 |
View all notes |
Set NEW NOTE alert |
Company Profile |
SEC
News |
Chart |
Request a new note
C
A
S
I |
Symbol/Exchange
Company Name
Industry Group |
PRICE |
CHANGE
(%Change) |
Day High |
Volume
(% DAV)
(% 50 day avg vol) |
52 Wk Hi
% From Hi |
Featured
Date |
Price
Featured |
Pivot Featured |
|
Max Buy |
IRBT
-
NASDAQ
Irobot Corp
CONSUMER DURABLES - Electronic Equipment
|
$121.69
|
-3.05
-2.45% |
$125.77
|
923,979
112.54% of 50 DAV
50 DAV is 821,000
|
$132.88
-8.42%
|
2/8/2019
|
$104.92
|
PP = $103.63
|
|
MB = $108.81
|
Most Recent Note - 3/7/2019 5:24:17 PM
G - Pulled back today for a 3rd consecutive loss with slightly higher (near average) volume. There was a "negative reversal" on 3/05/19 after quietly touching another new all-time high. Recent gains have lacked great volume conviction. It is extended from the previously noted "double bottom" base. Prior high ($103) defines initial support to watch on pullbacks.
>>> FEATURED STOCK ARTICLE : Volume-Driven Gains Cleared Prior High After Double Bottom - 2/8/2019 |
View all notes |
Set NEW NOTE alert |
Company Profile |
SEC
News |
Chart |
Request a new note
C
A
S
I |
LHCG
-
NASDAQ
L H C Group Inc
HEALTH SERVICES - Home Health Care
|
$106.31
|
+0.96
0.91% |
$106.60
|
172,095
65.69% of 50 DAV
50 DAV is 262,000
|
$114.22
-6.93%
|
1/23/2019
|
$107.29
|
PP = $107.61
|
|
MB = $112.99
|
Most Recent Note - 3/5/2019 8:53:38 PM
Y - Hovering near its all-time high with volume totals cooling. Bullish action came after it reported earnings +66% on +75% sales revenues for the Dec '18 quarter.
>>> FEATURED STOCK ARTICLE : Recent Gains for New Highs Lacked Great Volume Conviction - 2/21/2019 |
View all notes |
Set NEW NOTE alert |
Company Profile |
SEC
News |
Chart |
Request a new note
C
A
S
I |
ENSG
-
NASDAQ
Ensign Group Inc
HEALTH SERVICES - Long-Term Care Facilities
|
$48.17
|
-0.15
-0.31% |
$48.59
|
216,696
61.74% of 50 DAV
50 DAV is 351,000
|
$54.56
-11.71%
|
2/7/2019
|
$48.71
|
PP = $49.06
|
|
MB = $51.51
|
Most Recent Note - 3/6/2019 3:56:24 PM
Y - Pulling back on light volume, consolidating near prior highs in the $48 area defining initial support to watch.
>>> FEATURED STOCK ARTICLE : Closed Near Pivot Point After Gap Up and Big Volume-Driven Gain - 2/7/2019 |
View all notes |
Set NEW NOTE alert |
Company Profile |
SEC
News |
Chart |
Request a new note
C
A
S
I |
NXST
-
NASDAQ
Nexstar Media Group Cl A
MEDIA - Broadcasting - TV
|
$102.10
|
-1.11
-1.08% |
$103.58
|
558,885
98.57% of 50 DAV
50 DAV is 567,000
|
$104.03
-1.86%
|
2/26/2019
|
$94.26
|
PP = $89.76
|
|
MB = $94.25
|
Most Recent Note - 3/6/2019 6:07:02 PM
G - Posted a small gain on light volume today hitting another new all-time high. Disciplined investors avoid chasing stocks more than +5% above the prior high.
>>> FEATURED STOCK ARTICLE : Twice Average Volume Behind Gain for New High - 2/26/2019 |
View all notes |
Set NEW NOTE alert |
Company Profile |
SEC
News |
Chart |
Request a new note
C
A
S
I |
BSTC
-
NASDAQ
Biospecifics Technologie
Medical-Biomed/Biotech
|
$67.18
|
-0.13
-0.19% |
$69.00
|
25,500
57.95% of 50 DAV
50 DAV is 44,000
|
$73.31
-8.36%
|
1/18/2019
|
$67.40
|
PP = $66.31
|
|
MB = $69.63
|
Most Recent Note - 3/7/2019 5:18:22 PM
Y - Consolidating near prior highs and above its 50 DMA line ($65.19) defining important near-term support to watch. More damaging losses would raise concerns and trigger a technical sell signal. See the latest FSU analysis for more details and a new annotated graph.
>>> FEATURED STOCK ARTICLE : Consolidating Above 50-Day Moving Average and Prior Highs - 3/7/2019 |
View all notes |
Set NEW NOTE alert |
Company Profile |
SEC
News |
Chart |
Request a new note
C
A
S
I |
Symbol/Exchange
Company Name
Industry Group |
PRICE |
CHANGE
(%Change) |
Day High |
Volume
(% DAV)
(% 50 day avg vol) |
52 Wk Hi
% From Hi |
Featured
Date |
Price
Featured |
Pivot Featured |
|
Max Buy |
UBNT
-
NASDAQ
Ubiquiti Networks
TELECOMMUNICATIONS - Diversified Communication Serv
|
$139.58
|
-1.79
-1.27% |
$140.78
|
283,950
75.52% of 50 DAV
50 DAV is 376,000
|
$148.68
-6.12%
|
2/8/2019
|
$121.97
|
PP = $115.54
|
|
MB = $121.32
|
Most Recent Note - 3/5/2019 8:49:08 PM
G - Stubbornly holding its ground perched near its all-time high, very extended from the prior base. Fundamentals remain strong. Prior high ($115) defines initial support to watch on pullbacks. See the latest FSU analysis for more details and a new annotated graph.
>>> FEATURED STOCK ARTICLE : Bullish Action Came Following Another Strong Earnings Report - 3/5/2019 |
View all notes |
Set NEW NOTE alert |
Company Profile |
SEC
News |
Chart |
Request a new note
C
A
S
I |
NOW
-
NYSE
Servicenow Inc
Computer Sftwr-Enterprse
|
$233.37
|
+0.26
0.11% |
$236.82
|
1,573,463
71.10% of 50 DAV
50 DAV is 2,213,000
|
$245.33
-4.88%
|
1/31/2019
|
$218.14
|
PP = $206.40
|
|
MB = $216.72
|
Most Recent Note - 3/6/2019 5:53:13 PM
G - Down today with lighter volume. Prior high ($206) defines initial support to watch on pullbacks. See the latest FSU analysis for more details and a new annotated graph.
>>> FEATURED STOCK ARTICLE : Pulling Back After 6 Straight Weekly Gains - 3/6/2019 |
View all notes |
Set NEW NOTE alert |
Company Profile |
SEC
News |
Chart |
Request a new note
C
A
S
I |
PANW
-
NYSE
Palo Alto Networks
Computer Sftwr-Security
|
$234.52
|
+0.08
0.03% |
$238.78
|
1,400,465
95.01% of 50 DAV
50 DAV is 1,474,000
|
$260.63
-10.02%
|
2/25/2019
|
$233.54
|
PP = $239.60
|
|
MB = $251.58
|
Most Recent Note - 3/5/2019 8:51:02 PM
Y - Pulled back today on higher volume for a 4th consecutive loss, slumping below its pivot point and into the prior base raising concerns. Reported earnings +44% on +30% sales revenues for the Jan '19 quarter, continuing its strong earnings track record.
>>> FEATURED STOCK ARTICLE : Rebounded Near Prior High With Earnings News Due - 2/25/2019 |
View all notes |
Set NEW NOTE alert |
Company Profile |
SEC
News |
Chart |
Request a new note
C
A
S
I |
PAYC
-
NYSE
Paycom Software Inc
COMPUTER SOFTWARE and SERVICES - Application Software
|
$176.23
|
+0.59
0.34% |
$179.32
|
493,275
76.01% of 50 DAV
50 DAV is 649,000
|
$186.00
-5.25%
|
2/6/2019
|
$171.66
|
PP = $164.18
|
|
MB = $172.39
|
Most Recent Note - 3/4/2019 12:27:33 PM
G - Pulling back today with higher volume, encountering distributional pressure. Volume totals had been cooling while hovering near its all-time high, extended from any sound base. Prior high ($164) defines initial support to watch above its 50 DMA line.
>>> FEATURED STOCK ARTICLE : Breakaway Gap Backed by Volume +388% Above Average - 2/6/2019 |
View all notes |
Set NEW NOTE alert |
Company Profile |
SEC
News |
Chart |
Request a new note
C
A
S
I |
PYPL
-
NASDAQ
Paypal Holdings Inc
Finance-CrdtCard/PmtPr
|
$96.21
|
-0.25
-0.26% |
$96.75
|
6,075,677
72.99% of 50 DAV
50 DAV is 8,324,000
|
$99.45
-3.26%
|
1/24/2019
|
$92.56
|
PP = $93.80
|
|
MB = $98.49
|
Most Recent Note - 3/4/2019 8:32:15 PM
Y - Pulled back today with higher (near average) volume. Recent gains into new high territory came with light volume, not indicative of great institutional buying demand. Prior highs in the $92 area define support above its 50 DMA line ($90.54).
>>> FEATURED STOCK ARTICLE : Wedging into New High Territory With Gains Lacking Volume - 2/22/2019 |
View all notes |
Set NEW NOTE alert |
Company Profile |
SEC
News |
Chart |
Request a new note
C
A
S
I |
Symbol/Exchange
Company Name
Industry Group |
PRICE |
CHANGE
(%Change) |
Day High |
Volume
(% DAV)
(% 50 day avg vol) |
52 Wk Hi
% From Hi |
Featured
Date |
Price
Featured |
Pivot Featured |
|
Max Buy |
ALRM
-
NASDAQ
Alarm.com Holdings Inc
Security/Sfty
|
$57.76
|
+0.13
0.23% |
$58.74
|
426,542
73.29% of 50 DAV
50 DAV is 582,000
|
$65.85
-12.29%
|
1/22/2019
|
$60.52
|
PP = $60.30
|
|
MB = $63.32
|
Most Recent Note - 3/5/2019 9:00:57 PM
G - Rebounded above its 50 DMA line ($58.84) with today's big gain. Weak action came after it reported earnings +12% on +25% sales revenues for the Dec '18 quarter, below the +25% minimum earnings guideline (C criteria), raising fundamental concerns.
>>> FEATURED STOCK ARTICLE : Volume Totals Cooling While Perched at All-Time High - 2/20/2019 |
View all notes |
Set NEW NOTE alert |
Company Profile |
SEC
News |
Chart |
Request a new note
C
A
S
I |
PLNT
-
NYSE
Planet Fitness Inc Cl A
Leisure-Services
|
$63.89
|
+0.11
0.17% |
$64.43
|
1,449,941
98.10% of 50 DAV
50 DAV is 1,478,000
|
$64.50
-0.95%
|
11/7/2018
|
$57.10
|
PP = $55.45
|
|
MB = $58.22
|
Most Recent Note - 3/6/2019 6:09:35 PM
G - Posted a 7th consecutive gain today with above average volume hitting another new all-time high. Rallying after testing support at its 50 DMA line ($57.37) last week. Reported earnings +42% on +30% sales revenues for the Dec '18 quarter.
>>> FEATURED STOCK ARTICLE : Met Distributional Pressure While Hitting New High After Earnings - 2/27/2019 |
View all notes |
Set NEW NOTE alert |
Company Profile |
SEC
News |
Chart |
Request a new note
C
A
S
I |
TEAM
-
NASDAQ
Atlassian Corp Plc Cl A
Comp Sftwr-Spec Enterprs
|
$104.21
|
+0.71
0.69% |
$106.34
|
1,305,908
74.54% of 50 DAV
50 DAV is 1,752,000
|
$111.76
-6.76%
|
1/7/2019
|
$94.68
|
PP = $98.31
|
|
MB = $103.23
|
Most Recent Note - 3/4/2019 8:26:25 PM
G - Loss today came with above average volume after wedging to new all-time highs with recent gains lacking great volume conviction. Color code is changed to green after finishing the session back above its "max buy" level. Prior high ($98.21) and 50 DMA line ($96.57) define near-term support to watch on pullbacks. Fundamentals remain strong. See the latest FSU analysis for more details and a new annotated graph.
>>> FEATURED STOCK ARTICLE : Pullback on Higher Volume After Recent Gains With Less Volume - 3/4/2019 |
View all notes |
Set NEW NOTE alert |
Company Profile |
SEC
News |
Chart |
Request a new note
C
A
S
I |
GLOB
-
NYSE
Globant SA
Computer-Tech Services
|
$69.20
|
+0.09
0.13% |
$69.62
|
201,634
88.05% of 50 DAV
50 DAV is 229,000
|
$74.00
-6.49%
|
2/15/2019
|
$69.35
|
PP = $70.00
|
|
MB = $73.50
|
Most Recent Note - 3/6/2019 5:56:33 PM
Y - Pulled back today with higher (near average) volume than the prior session. Still sputtering since recently rallying from an advanced "3-weeks tight" base. Prior low ($65.73 on 2/08/19) defines near-term support above its 50 DMA line ($64.68).
>>> FEATURED STOCK ARTICLE : Volume-Driven Gain From Advanced "3-Weeks Tight" Base - 2/15/2019 |
View all notes |
Set NEW NOTE alert |
Company Profile |
SEC
News |
Chart |
Request a new note
C
A
S
I |
TTD
-
NASDAQ
The Trade Desk Inc Cl A
Comml Svcs-Advertising
|
$188.80
|
+2.45
1.31% |
$191.89
|
1,384,419
101.80% of 50 DAV
50 DAV is 1,360,000
|
$202.30
-6.67%
|
2/6/2019
|
$148.65
|
PP = $149.00
|
|
MB = $156.45
|
Most Recent Note - 3/6/2019 3:54:49 PM
G - Consolidating near its all-time high, well above its "max buy" level. Prior high ($161) defines initial support to watch. Bullish action came after it recently reported earnings +102% on +56% sales revenues for the Dec '18 quarter.
>>> FEATURED STOCK ARTICLE : Near High After Third Consecutive Gain with Light Volume - 2/12/2019 |
View all notes |
Set NEW NOTE alert |
Company Profile |
SEC
News |
Chart |
Request a new note
C
A
S
I |
Symbol/Exchange
Company Name
Industry Group |
PRICE |
CHANGE
(%Change) |
Day High |
Volume
(% DAV)
(% 50 day avg vol) |
52 Wk Hi
% From Hi |
Featured
Date |
Price
Featured |
Pivot Featured |
|
Max Buy |
|
|
|
THESE ARE NOT BUY RECOMMENDATIONS!
Comments contained in the body of this report are technical
opinions only. The material herein has been obtained
from sources believed to be reliable and accurate, however,
its accuracy and completeness cannot be guaranteed.
This site is not an investment advisor, hence it does
not endorse or recommend any securities or other investments.
Any recommendation contained in this report may not
be suitable for all investors and it is not to be deemed
an offer or solicitation on our part with respect to
the purchase or sale of any securities. All trademarks,
service marks and trade names appearing in this report
are the property of their respective owners, and are
likewise used for identification purposes only.
This report is a service available
only to active Paid Premium Members.
You may opt-out of receiving report notifications
at any time. Questions or comments may be submitted
by writing to Premium Membership Services 665 S.E. 10 Street, Suite 201 Deerfield Beach, FL 33441-5634 or by calling 1-800-965-8307
or 954-785-1121.
|
|
|

