You are not logged in.
This means you
CAN ONLY VIEW reports that were published prior to Sunday, February 25, 2024.
You
MUST UPGRADE YOUR MEMBERSHIP if you want to see any current reports.
AFTER MARKET UPDATE - FRIDAY, MARCH 6TH, 2020
Previous After Market Report Next After Market Report >>>
|
|
|
|
DOW |
-256.50 |
25,864.78 |
-0.98% |
|
Volume |
1,608,441,740 |
+15% |
|
Volume |
4,271,458,400 |
+14% |
|
NASDAQ |
-162.98 |
8,575.62 |
-1.87% |
|
Advancers |
521 |
19% |
|
Advancers |
691 |
21% |
|
S&P 500 |
-51.57 |
2,972.37 |
-1.71% |
|
Decliners |
2,260 |
81% |
|
Decliners |
2,535 |
79% |
|
Russell 2000 |
-29.60 |
1,449.22 |
-2.00% |
|
52 Wk Highs |
28 |
|
|
52 Wk Highs |
62 |
|
|
S&P 600 |
-16.47 |
867.20 |
-1.86% |
|
52 Wk Lows |
714 |
|
|
52 Wk Lows |
623 |
|
|
During market corrections it is especially important to reduce exposure, preserve your capital, and just be patient. Be safe! Historic studies have shown that the biggest up sessions have occurred during market corrections and bear markets.
Disciplined investors know to wait until a new confirmed rally marked by a solid follow-through day. The bold portion of the daily market commentary will note when that happens. For any clarification or additional help applying the fact-based investment system, we invite members to call, or contact us via the inquiry form.
|
 |
Leadership Evaporated as Market Correction Has Worsened
Kenneth J. Gruneisen - Passed the CAN SLIM® Master's Exam
The Dow lost 256 points, while the S&P 500 and Nasdaq Composite fell 1.7% and 1.9%, respectively. For the week, the S&P 500 advanced 0.6%, having notched daily moves of at least 2.8% during four of the past five sessions. The Dow added 1.8% on the week, while the Nasdaq ticked up 0.1%. Breadth was clearly negative as decliners led advancers by a 4-1 margin on the NYSE and by nearly 4-1 on the Nasdaq exchange. The reported volume totals were higher than the prior session totals on the NYSE and on the Nasdaq exchange, revealing more distributional selling pressure from the institutional crowd. Leadership remained thin as there were only 4 high-ranked companies from the Leaders List that hit a new 52-week high and were listed on the BreakOuts Page, versus 11 on the prior session. New 52-week lows totals swelled again and easily outnumbered new 52-week highs on the NYSE and on the Nasdaq exchange. The major indices' (M criteria) have been in a noted "market correction". Disciplined investors know to watch for a follow-through day of gains on higher volume to confirm a new market uptrend. The Featured Stocks Page provides the most timely analysis on high-ranked leaders. Charts used courtesy of www.stockcharts.com
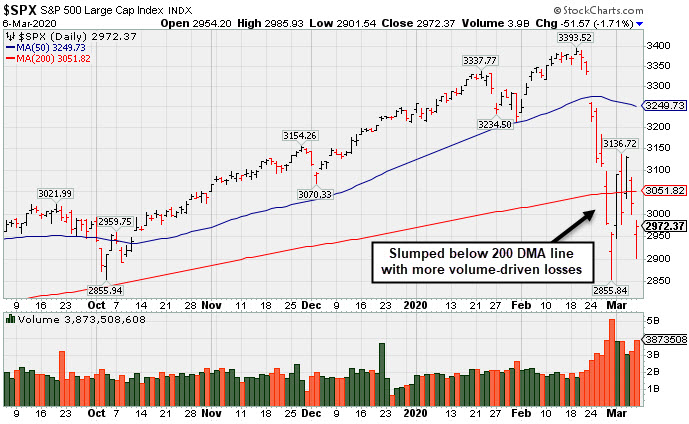
PICTURED: The S&P 500 Index slumped back below its 200-day moving average (DMA) line with more damaging volume-driven losses. The benchmark index is -12.4% off its all-time high hit on 2/19/20. Disciplined investors will watch for a follow-through day of big gains on higher volume to signal a new confirmed rally.
Stocks finished lower Friday, as growing concern over the economic fallout from the coronavirus continues to inspire a rally in perceived safe-haven assets. Longer dated Treasury yields hit historic lows, while gold added 0.3% and recorded its best weekly gain in 11 years.
Treasuries continued to rally, with the yield on the 10-year note slumping 13 basis points to 0.78%. The 30-year bond rate dropped 21 basis points to 1.33%, representing its largest single-day decline in nine years. On the data front, nonfarm payrolls surged by 273,000 in February, the biggest monthly gain since May 2018. Meanwhile, the unemployment rate ticked down to a 50-year low of 3.5%.
All 11 S&P 500 sectors finished the session lower with Energy stocks leading the losses after news that Russia will not endorse proposed OPEC production cuts. WTI crude sank 10.1% to $41.50/barrel, its lowest close since 2016. Elsewhere, airline stocks bucked the downtrend following a report the White House is considering “targeted measures” to provide relief to the industry. In corporate news, Costco (COST -1.40%) fell despite the retailer revealing a 12.1% increase in February comparable store sales, beating consensus estimates of 6.8%. JP Morgan Chase & Co (JPM -5.17%) fell following the CEO, Jamie Dimon, undergoing unexpected heart surgery that was reported to be successful. |
 Kenneth J. Gruneisen started out as a licensed stockbroker in August 1987, a couple of months prior to the historic stock market crash that took the Dow Jones Industrial Average down -22.6% in a single day. He has published daily fact-based fundamental and technical analysis on high-ranked stocks online for two decades. Through FACTBASEDINVESTING.COM, Kenneth provides educational articles, news, market commentary, and other information regarding proven investment systems that work in good times and bad.
Comments contained in the body of this report are technical opinions only and are not necessarily those of Gruneisen Growth Corp. The material herein has been obtained from sources believed to be reliable and accurate, however, its accuracy and completeness cannot be guaranteed. Our firm, employees, and customers may effect transactions, including transactions contrary to any recommendation herein, or have positions in the securities mentioned herein or options with respect thereto. Any recommendation contained in this report may not be suitable for all investors and it is not to be deemed an offer or solicitation on our part with respect to the purchase or sale of any securities. |
|
 |
Energy, Financial, Tech, and Retail Indexes Fell
Kenneth J. Gruneisen - Passed the CAN SLIM® Master's Exam
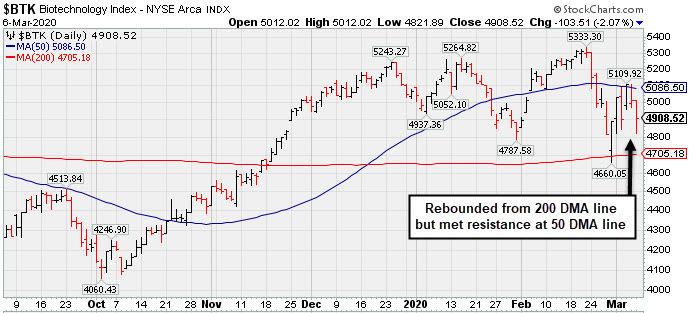
The Bank Index ($BKX -4.53%) and Broker/Dealer Index ($XBD -2.78%) were standout decliners and the Retail Index ($RLX -1.30%) also fell on Friday. The tech sector had a clearly negative bias as the Semiconductor Index ($SOX -1.97%), Networking Index ($NWX -1.01%), and the Biotech Index ($BTK -2.07%) slumped. Energy-linked groups were standout decliners again as the Oil Services Index ($OSX -11.41%) and the Integrated Oil Index ($XOI -5.88%) slumped badly. The Gold & Silver Index ($XAU -1.61%) also lost ground on the widely negative session.
PICTURED: The Biotech Index ($BTK -2.07%) rebounded from its 200-day moving average (DMA) line but met resistance at its 50 DMA line.
| Oil Services |
$OSX |
42.03 |
-5.41 |
-11.40% |
-46.31% |
| Integrated Oil |
$XOI |
873.41 |
-54.54 |
-5.88% |
-31.26% |
| Semiconductor |
$SOX |
1,699.89 |
-34.14 |
-1.97% |
-8.10% |
| Networking |
$NWX |
487.29 |
-4.95 |
-1.01% |
-16.48% |
| Broker/Dealer |
$XBD |
253.31 |
-7.25 |
-2.78% |
-12.77% |
| Retail |
$RLX |
2,381.45 |
-31.34 |
-1.30% |
-2.77% |
| Gold & Silver |
$XAU |
103.01 |
-1.69 |
-1.61% |
-3.66% |
| Bank |
$BKX |
83.88 |
-3.98 |
-4.53% |
-26.01% |
| Biotech |
$BTK |
4,908.52 |
-103.51 |
-2.07% |
-3.14% |
|
|
|
 |
Featured Stocks
Kenneth J. Gruneisen - Passed the CAN SLIM® Master's Exam
See the Featured Stocks with most recent note below. Feel free to contact us if you have a need for any additional information. |
|
|
Color Codes Explained :
Y - Better candidates highlighted by our
staff of experts.
G - Previously featured
in past reports as yellow but may no longer be buyable under the
guidelines.
***Last / Change / Volume data in this table is the closing quote data***
Symbol/Exchange
Company Name
Industry Group |
PRICE |
CHANGE
(%Change) |
Day High |
Volume
(% DAV)
(% 50 day avg vol) |
52 Wk Hi
% From Hi |
Featured
Date |
Price
Featured |
Pivot Featured |
|
Max Buy |
 FTNT
-
NASDAQ
FTNT
-
NASDAQ
Fortinet Inc
Computer Sftwr-Security
|
$99.50
|
-4.50
-4.33% |
$102.86
|
3,417,629
255.81% of 50 DAV
50 DAV is 1,336,000
|
$121.82
-18.32%
|
12/9/2019
|
$103.85
|
PP = $106.10
|
|
MB = $111.41
|
 Most Recent Note - 3/6/2020 5:28:48 PM
G - Suffered another damaging loss with above average volume today. A rebound above the 50 DMA line ($113) is needed for its outlook to improve. Reported earnings +29% on +21% sales revenues for the Dec '19 quarter, continuing its strong earnings track record above the +25% minimum guideline (C criteria).
>>> FEATURED STOCK ARTICLE : Volume Driven Losses Violated 50-Day Moving Average - 2/26/2020 |
View all notes |
Set NEW NOTE alert |
Company Profile |
SEC
News |
Chart |
Request a new note
C
A
S
I |
PAYC
-
NYSE
Paycom Software Inc
COMPUTER SOFTWARE and SERVICES - Application Software
|
$267.71
|
-14.55
-5.15% |
$274.97
|
1,030,128
104.16% of 50 DAV
50 DAV is 989,000
|
$342.00
-21.72%
|
11/20/2019
|
$252.97
|
PP = $259.81
|
|
MB = $272.80
|
Most Recent Note - 3/6/2020 5:29:59 PM
G - Gapped down today for another damaging loss. Met resistance near its 50 DMA line ($295), and gains above that important short-term average still are needed to help its outlook improve. Fundamentals remain strong after it reported earnings +41% on +29% for the Dec '19 quarter.
>>> FEATURED STOCK ARTICLE : Sputtering Below 50-Day Moving Average - 3/3/2020 |
View all notes |
Set NEW NOTE alert |
Company Profile |
SEC
News |
Chart |
Request a new note
C
A
S
I |
TEAM
-
NASDAQ
Atlassian Corp Plc Cl A
Comp Sftwr-Spec Enterprs
|
$144.36
|
-7.85
-5.16% |
$151.09
|
2,461,598
148.65% of 50 DAV
50 DAV is 1,656,000
|
$156.12
-7.53%
|
1/24/2020
|
$144.66
|
PP = $140.49
|
|
MB = $147.51
|
Most Recent Note - 3/6/2020 5:33:56 PM
G - Pulled back below its "max buy" level testing support at its 50 DMA line ($140) with today's damaging volume-driven loss amid widespread market weakness (M criteria). Fundamentals remain strong.
>>> FEATURED STOCK ARTICLE : Found Support at 50-Day Average During Recent Consolidation - 3/4/2020 |
View all notes |
Set NEW NOTE alert |
Company Profile |
SEC
News |
Chart |
Request a new note
C
A
S
I |
STNE
-
NASDAQ
Stoneco Ltd Cl A
Finance-CrdtCard/PmtPr
|
$40.00
|
-1.71
-4.10% |
$40.39
|
3,579,219
169.15% of 50 DAV
50 DAV is 2,116,000
|
$46.69
-14.33%
|
1/22/2020
|
$43.94
|
PP = $45.72
|
|
MB = $48.01
|
Most Recent Note - 3/6/2020 5:32:11 PM
G - Violated its 50 DMA line ($41.95) with a damaging volume-driven loss and its color code is changed to green. A rebound is needed for its outlook to improve. Stalled after touching a new all-time high with volume-driven gains this week. Reported earnings +71% on +43% sales revenues for the Dec '19 quarter, continuing its strong earnings track record. The worrisome market correction (M criteria) is cause for concern.
>>> FEATURED STOCK ARTICLE : Volume-Driven Gain Above 50-Day Moving Average - 3/2/2020 |
View all notes |
Set NEW NOTE alert |
Company Profile |
SEC
News |
Chart |
Request a new note
C
A
S
I |
DAVA
-
NYSE
Endava Plc Cl A Ads
Computer-Tech Services
|
$50.43
|
-2.54
-4.80% |
$52.96
|
233,876
175.85% of 50 DAV
50 DAV is 133,000
|
$56.76
-11.15%
|
2/13/2020
|
$53.71
|
PP = $49.86
|
|
MB = $52.35
|
Most Recent Note - 3/6/2020 5:27:23 PM
G - Churned above average volume behind today's 3rd consecutive loss, finishing -11.2% off its all-time high. Prior highs in the $49 area define initial support to watch above its 50 DMA line ($48.97).
>>> FEATURED STOCK ARTICLE : Breakout Gain Backed By +462% Above Average Volme - 2/13/2020 |
View all notes |
Set NEW NOTE alert |
Company Profile |
SEC
News |
Chart |
Request a new note
C
A
S
I |
Symbol/Exchange
Company Name
Industry Group |
PRICE |
CHANGE
(%Change) |
Day High |
Volume
(% DAV)
(% 50 day avg vol) |
52 Wk Hi
% From Hi |
Featured
Date |
Price
Featured |
Pivot Featured |
|
Max Buy |
|
|
|
THESE ARE NOT BUY RECOMMENDATIONS!
Comments contained in the body of this report are technical
opinions only. The material herein has been obtained
from sources believed to be reliable and accurate, however,
its accuracy and completeness cannot be guaranteed.
This site is not an investment advisor, hence it does
not endorse or recommend any securities or other investments.
Any recommendation contained in this report may not
be suitable for all investors and it is not to be deemed
an offer or solicitation on our part with respect to
the purchase or sale of any securities. All trademarks,
service marks and trade names appearing in this report
are the property of their respective owners, and are
likewise used for identification purposes only.
This report is a service available
only to active Paid Premium Members.
You may opt-out of receiving report notifications
at any time. Questions or comments may be submitted
by writing to Premium Membership Services 665 S.E. 10 Street, Suite 201 Deerfield Beach, FL 33441-5634 or by calling 1-800-965-8307
or 954-785-1121.
|
|
|