***Last / Change / Volume data in this table is the closing quote data***
Symbol/Exchange
Company Name
Industry Group |
PRICE |
CHANGE
(%Change) |
Day High |
Volume
(% DAV)
(% 50 day avg vol) |
52 Wk Hi
% From Hi |
Featured
Date |
Price
Featured |
Pivot Featured |
|
Max Buy |
MLR
-
NYSE
Miller Industries Inc
AUTOMOTIVE - Auto Parts
|
$34.84
|
-0.23
-0.66% |
$35.26
|
23,693
69.69% of 50 DAV
50 DAV is 34,000
|
$35.24
-1.14%
|
11/30/2018
|
$28.35
|
PP = $29.50
|
|
MB = $30.98
|
Most Recent Note - 3/4/2019 8:37:24 PM
G - Hit another new high with today's volume-driven gain adding to an impressive streak of gains. Prior highs and its 50 DMA line ($29.71) define near-term support to watch on pullbacks. See the latest FSU analysis for more details and an annotated graph.
>>> FEATURED STOCK ARTICLE : Extended From Prior Base After Impressive Streak of Gains - 3/1/2019 |
View all notes |
Set NEW NOTE alert |
Company Profile |
SEC
News |
Chart |
Request a new note
C
A
S
I |
NSP
-
NYSE
Insperity Inc
Comml Svcs-Outsourcing
|
$124.60
|
-0.56
-0.45% |
$125.69
|
222,170
60.54% of 50 DAV
50 DAV is 367,000
|
$132.50
-5.96%
|
2/11/2019
|
$127.91
|
PP = $121.25
|
|
MB = $127.31
|
Most Recent Note - 3/4/2019 8:27:52 PM
Y - Quietly consolidating below its "max buy" level. Prior highs in the $119-121 area define initial support to watch on pullbacks.
>>> FEATURED STOCK ARTICLE : Big Breakaway Gap Triggered Technical Buy Signal - 2/11/2019 |
View all notes |
Set NEW NOTE alert |
Company Profile |
SEC
News |
Chart |
Request a new note
C
A
S
I |
ZBRA
-
NASDAQ
Zebra Tech Corp Cl A
COMPUTER HARDWARE - Computer Peripherals
|
$201.64
|
-0.09
-0.04% |
$203.12
|
315,451
61.02% of 50 DAV
50 DAV is 517,000
|
$207.88
-3.00%
|
2/14/2019
|
$198.10
|
PP = $184.85
|
|
MB = $194.09
|
 Most Recent Note - 3/5/2019 8:58:51 PM
G - Still stubbornly holding its ground in a tight range near its all-time high with volume totals cooling. Extended from the prior base. Prior highs in the $184 area define initial support to watch on pullbacks.
>>> FEATURED STOCK ARTICLE : Big Volume-Driven Gain for New High - 2/14/2019 |
View all notes |
Set NEW NOTE alert |
Company Profile |
SEC
News |
Chart |
Request a new note
C
A
S
I |
SPSC
-
NASDAQ
S P S Commerce Inc
COMPUTER SOFTWARE and SERVICES - Application Software
|
$106.87
|
+0.68
0.64% |
$107.28
|
95,727
56.98% of 50 DAV
50 DAV is 168,000
|
$113.31
-5.68%
|
2/13/2019
|
$104.30
|
PP = $100.78
|
|
MB = $105.82
|
Most Recent Note - 3/1/2019 6:09:45 PM
G - It is extended from the previously noted base, consolidating well above prior highs in the $100 area which define initial support to watch.
>>> FEATURED STOCK ARTICLE : Gap Up and Big Volume Driven Gain for New High - 2/13/2019 |
View all notes |
Set NEW NOTE alert |
Company Profile |
SEC
News |
Chart |
Request a new note
C
A
S
I |
SSNC
-
NASDAQ
S S & C Technologies
COMPUTER SOFTWARE and SERVICES - Application Software
|
$62.26
|
+0.30
0.48% |
$62.85
|
1,402,008
72.79% of 50 DAV
50 DAV is 1,926,000
|
$64.36
-3.26%
|
2/15/2019
|
$59.73
|
PP = $61.07
|
|
MB = $64.12
|
Most Recent Note - 3/1/2019 6:03:11 PM
Y - Hit another new high with today's gain above its pivot point backed by +49% above average volume triggering a technical buy signal. Stubbornly held its ground after highlighted in yellow in the 2/15/19 mid-day report.
>>> FEATURED STOCK ARTICLE : Volume-Driven Gain for New High Close - 2/19/2019 |
View all notes |
Set NEW NOTE alert |
Company Profile |
SEC
News |
Chart |
Request a new note
C
A
S
I |
Symbol/Exchange
Company Name
Industry Group |
PRICE |
CHANGE
(%Change) |
Day High |
Volume
(% DAV)
(% 50 day avg vol) |
52 Wk Hi
% From Hi |
Featured
Date |
Price
Featured |
Pivot Featured |
|
Max Buy |
IRBT
-
NASDAQ
Irobot Corp
CONSUMER DURABLES - Electronic Equipment
|
$129.36
|
-1.42
-1.09% |
$132.88
|
502,391
60.97% of 50 DAV
50 DAV is 824,000
|
$130.79
-1.09%
|
2/8/2019
|
$104.92
|
PP = $103.63
|
|
MB = $108.81
|
Most Recent Note - 3/1/2019 5:59:07 PM
G - Hit another new all-time high with average volume behind today's 3rd consecutive gain. Recent gains have lacked great volume conviction. It is extended from the previously noted "double bottom" base. Prior high ($103) defines initial support to watch on pullbacks.
>>> FEATURED STOCK ARTICLE : Volume-Driven Gains Cleared Prior High After Double Bottom - 2/8/2019 |
View all notes |
Set NEW NOTE alert |
Company Profile |
SEC
News |
Chart |
Request a new note
C
A
S
I |
LHCG
-
NASDAQ
L H C Group Inc
HEALTH SERVICES - Home Health Care
|
$108.12
|
-1.06
-0.97% |
$109.75
|
205,990
77.44% of 50 DAV
50 DAV is 266,000
|
$114.22
-5.34%
|
1/23/2019
|
$107.29
|
PP = $107.61
|
|
MB = $112.99
|
Most Recent Note - 3/5/2019 8:53:38 PM
Y - Hovering near its all-time high with volume totals cooling. Bullish action came after it reported earnings +66% on +75% sales revenues for the Dec '18 quarter.
>>> FEATURED STOCK ARTICLE : Recent Gains for New Highs Lacked Great Volume Conviction - 2/21/2019 |
View all notes |
Set NEW NOTE alert |
Company Profile |
SEC
News |
Chart |
Request a new note
C
A
S
I |
ENSG
-
NASDAQ
Ensign Group Inc
HEALTH SERVICES - Long-Term Care Facilities
|
$50.13
|
-0.49
-0.97% |
$51.51
|
312,742
88.10% of 50 DAV
50 DAV is 355,000
|
$54.56
-8.12%
|
2/7/2019
|
$48.71
|
PP = $49.06
|
|
MB = $51.51
|
Most Recent Note - 3/1/2019 6:08:32 PM
Y - Volume totals have been cooling while consolidating above prior highs in the $48 area defining initial support to watch.
>>> FEATURED STOCK ARTICLE : Closed Near Pivot Point After Gap Up and Big Volume-Driven Gain - 2/7/2019 |
View all notes |
Set NEW NOTE alert |
Company Profile |
SEC
News |
Chart |
Request a new note
C
A
S
I |
NXST
-
NASDAQ
Nexstar Media Group Cl A
MEDIA - Broadcasting - TV
|
$102.50
|
+1.77
1.76% |
$103.75
|
882,324
150.82% of 50 DAV
50 DAV is 585,000
|
$102.70
-0.19%
|
2/26/2019
|
$94.26
|
PP = $89.76
|
|
MB = $94.25
|
Most Recent Note - 3/1/2019 1:39:09 PM
G - Color code is changed to green after rallying above its "max buy"level with a 4th consecutive volume-driven gain. Recent quarterly comparisons through Dec '18 showed strong earnings increases above the +25% minimum guideline (C criteria) versus the year ago periods with encouraging sales revenues acceleration. See the latest FSU analysis for more details and an annotated graph.
>>> FEATURED STOCK ARTICLE : Twice Average Volume Behind Gain for New High - 2/26/2019 |
View all notes |
Set NEW NOTE alert |
Company Profile |
SEC
News |
Chart |
Request a new note
C
A
S
I |
BSTC
-
NASDAQ
Biospecifics Technologie
Medical-Biomed/Biotech
|
$69.10
|
-2.02
-2.84% |
$71.67
|
31,256
69.46% of 50 DAV
50 DAV is 45,000
|
$73.31
-5.74%
|
1/18/2019
|
$67.40
|
PP = $66.31
|
|
MB = $69.63
|
Most Recent Note - 3/5/2019 9:02:16 PM
Y - Color code is changed to yellow after pulling back below its "max buy" level with today's loss on lighter than average volume. Prior highs and its 50 DMA line define near-term support to watch on pullbacks.
>>> FEATURED STOCK ARTICLE : Reversed Into Red After Hitting a New High - 2/5/2019 |
View all notes |
Set NEW NOTE alert |
Company Profile |
SEC
News |
Chart |
Request a new note
C
A
S
I |
Symbol/Exchange
Company Name
Industry Group |
PRICE |
CHANGE
(%Change) |
Day High |
Volume
(% DAV)
(% 50 day avg vol) |
52 Wk Hi
% From Hi |
Featured
Date |
Price
Featured |
Pivot Featured |
|
Max Buy |
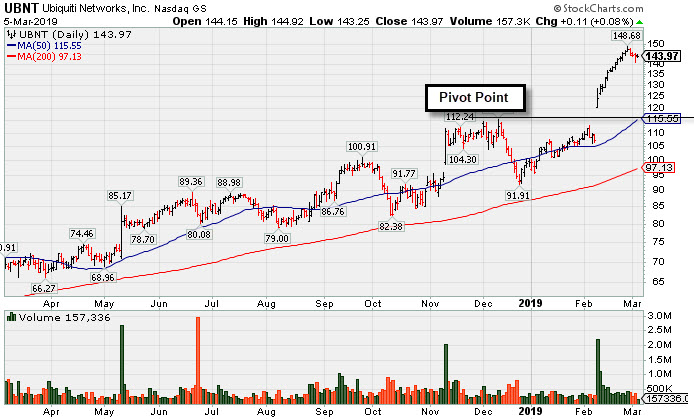
UBNT
-
NASDAQ
Ubiquiti Networks
TELECOMMUNICATIONS - Diversified Communication Serv
|
$143.97
|
+0.11
0.08% |
$144.92
|
157,336
40.34% of 50 DAV
50 DAV is 390,000
|
$148.68
-3.17%
|
2/8/2019
|
$121.97
|
PP = $115.54
|
|
MB = $121.32
|
Most Recent Note - 3/5/2019 8:49:08 PM
G - Stubbornly holding its ground perched near its all-time high, very extended from the prior base. Fundamentals remain strong. Prior high ($115) defines initial support to watch on pullbacks. See the latest FSU analysis for more details and a new annotated graph.
>>> FEATURED STOCK ARTICLE : Bullish Action Came Following Another Strong Earnings Report - 3/5/2019 |
View all notes |
Set NEW NOTE alert |
Company Profile |
SEC
News |
Chart |
Request a new note
C
A
S
I |
NOW
-
NYSE
Servicenow Inc
Computer Sftwr-Enterprse
|
$236.00
|
-0.97
-0.41% |
$237.57
|
1,940,199
85.96% of 50 DAV
50 DAV is 2,257,000
|
$245.33
-3.80%
|
1/31/2019
|
$218.14
|
PP = $206.40
|
|
MB = $216.72
|
Most Recent Note - 3/4/2019 12:26:26 PM
G - Reversed into the red today for a loss on higher volume after wedging to new all-time highs with recent gains lacking great volume. Prior high ($206) defines initial support to watch on pullbacks.
>>> FEATURED STOCK ARTICLE : Breakaway Gap Followed Strong Earnings Report - 2/1/2019 |
View all notes |
Set NEW NOTE alert |
Company Profile |
SEC
News |
Chart |
Request a new note
C
A
S
I |
PANW
-
NYSE
Palo Alto Networks
Computer Sftwr-Security
|
$234.34
|
-8.20
-3.38% |
$240.63
|
2,767,822
190.62% of 50 DAV
50 DAV is 1,452,000
|
$260.63
-10.09%
|
2/25/2019
|
$233.54
|
PP = $239.60
|
|
MB = $251.58
|
Most Recent Note - 3/5/2019 8:51:02 PM
Y - Pulled back today on higher volume for a 4th consecutive loss, slumping below its pivot point and into the prior base raising concerns. Reported earnings +44% on +30% sales revenues for the Jan '19 quarter, continuing its strong earnings track record.
>>> FEATURED STOCK ARTICLE : Rebounded Near Prior High With Earnings News Due - 2/25/2019 |
View all notes |
Set NEW NOTE alert |
Company Profile |
SEC
News |
Chart |
Request a new note
C
A
S
I |
PAYC
-
NYSE
Paycom Software Inc
COMPUTER SOFTWARE and SERVICES - Application Software
|
$178.57
|
+1.15
0.65% |
$178.99
|
389,116
59.68% of 50 DAV
50 DAV is 652,000
|
$186.00
-3.99%
|
2/6/2019
|
$171.66
|
PP = $164.18
|
|
MB = $172.39
|
Most Recent Note - 3/4/2019 12:27:33 PM
G - Pulling back today with higher volume, encountering distributional pressure. Volume totals had been cooling while hovering near its all-time high, extended from any sound base. Prior high ($164) defines initial support to watch above its 50 DMA line.
>>> FEATURED STOCK ARTICLE : Breakaway Gap Backed by Volume +388% Above Average - 2/6/2019 |
View all notes |
Set NEW NOTE alert |
Company Profile |
SEC
News |
Chart |
Request a new note
C
A
S
I |
PYPL
-
NASDAQ
Paypal Holdings Inc
Finance-CrdtCard/PmtPr
|
$96.53
|
-0.04
-0.04% |
$97.14
|
6,321,889
73.43% of 50 DAV
50 DAV is 8,609,000
|
$99.45
-2.94%
|
1/24/2019
|
$92.56
|
PP = $93.80
|
|
MB = $98.49
|
Most Recent Note - 3/4/2019 8:32:15 PM
Y - Pulled back today with higher (near average) volume. Recent gains into new high territory came with light volume, not indicative of great institutional buying demand. Prior highs in the $92 area define support above its 50 DMA line ($90.54).
>>> FEATURED STOCK ARTICLE : Wedging into New High Territory With Gains Lacking Volume - 2/22/2019 |
View all notes |
Set NEW NOTE alert |
Company Profile |
SEC
News |
Chart |
Request a new note
C
A
S
I |
Symbol/Exchange
Company Name
Industry Group |
PRICE |
CHANGE
(%Change) |
Day High |
Volume
(% DAV)
(% 50 day avg vol) |
52 Wk Hi
% From Hi |
Featured
Date |
Price
Featured |
Pivot Featured |
|
Max Buy |
ALRM
-
NASDAQ
Alarm.com Holdings Inc
Security/Sfty
|
$59.22
|
+2.14
3.75% |
$59.67
|
826,142
145.19% of 50 DAV
50 DAV is 569,000
|
$65.85
-10.07%
|
1/22/2019
|
$60.52
|
PP = $60.30
|
|
MB = $63.32
|
Most Recent Note - 3/5/2019 9:00:57 PM
G - Rebounded above its 50 DMA line ($58.84) with today's big gain. Weak action came after it reported earnings +12% on +25% sales revenues for the Dec '18 quarter, below the +25% minimum earnings guideline (C criteria), raising fundamental concerns.
>>> FEATURED STOCK ARTICLE : Volume Totals Cooling While Perched at All-Time High - 2/20/2019 |
View all notes |
Set NEW NOTE alert |
Company Profile |
SEC
News |
Chart |
Request a new note
C
A
S
I |
PLNT
-
NYSE
Planet Fitness Inc Cl A
Leisure-Services
|
$63.62
|
+1.88
3.05% |
$63.93
|
2,267,328
157.23% of 50 DAV
50 DAV is 1,442,000
|
$61.94
2.71%
|
11/7/2018
|
$57.10
|
PP = $55.45
|
|
MB = $58.22
|
Most Recent Note - 3/1/2019 6:11:39 PM
G - Posted a 4th consecutive gain today with above average volume, rising further above its "max buy" level. Found support near its 50 DMA line ($56.78) and recent low. Reported earnings +42% on +30% sales revenues for the Dec '18 quarter. Volume and volatility often increase near earnings news. See the latest FSU analysis for additional details and an annotated graph.
>>> FEATURED STOCK ARTICLE : Met Distributional Pressure While Hitting New High After Earnings - 2/27/2019 |
View all notes |
Set NEW NOTE alert |
Company Profile |
SEC
News |
Chart |
Request a new note
C
A
S
I |
TEAM
-
NASDAQ
Atlassian Corp Plc Cl A
Comp Sftwr-Spec Enterprs
|
$104.43
|
-0.28
-0.27% |
$105.33
|
1,309,837
72.69% of 50 DAV
50 DAV is 1,802,000
|
$111.76
-6.56%
|
1/7/2019
|
$94.68
|
PP = $98.31
|
|
MB = $103.23
|
Most Recent Note - 3/4/2019 8:26:25 PM
G - Loss today came with above average volume after wedging to new all-time highs with recent gains lacking great volume conviction. Color code is changed to green after finishing the session back above its "max buy" level. Prior high ($98.21) and 50 DMA line ($96.57) define near-term support to watch on pullbacks. Fundamentals remain strong. See the latest FSU analysis for more details and a new annotated graph.
>>> FEATURED STOCK ARTICLE : Pullback on Higher Volume After Recent Gains With Less Volume - 3/4/2019 |
View all notes |
Set NEW NOTE alert |
Company Profile |
SEC
News |
Chart |
Request a new note
C
A
S
I |
GLOB
-
NYSE
Globant SA
Computer-Tech Services
|
$71.12
|
-0.17
-0.24% |
$71.38
|
126,336
53.76% of 50 DAV
50 DAV is 235,000
|
$74.00
-3.89%
|
2/15/2019
|
$69.35
|
PP = $70.00
|
|
MB = $73.50
|
Most Recent Note - 3/1/2019 6:13:08 PM
Y - Sputtering since recently rallying from an advanced "3-weeks tight" base. Prior low ($65.73 on 2/08/19) defines near-term support above its 50 DMA line ($63.78).
>>> FEATURED STOCK ARTICLE : Volume-Driven Gain From Advanced "3-Weeks Tight" Base - 2/15/2019 |
View all notes |
Set NEW NOTE alert |
Company Profile |
SEC
News |
Chart |
Request a new note
C
A
S
I |
TTD
-
NASDAQ
The Trade Desk Inc Cl A
Comml Svcs-Advertising
|
$191.23
|
+1.85
0.98% |
$192.11
|
993,073
72.65% of 50 DAV
50 DAV is 1,367,000
|
$202.30
-5.47%
|
2/6/2019
|
$148.65
|
PP = $149.00
|
|
MB = $156.45
|
Most Recent Note - 3/1/2019 6:07:23 PM
G - Still stubbornly holding its ground near its all-time high, above its "max buy" level. Bullish action on the prior session came after it reported earnings +102% on +56% sales revenues for the Dec '18 quarter. Prior high ($161) defines initial support to watch on pullbacks.
>>> FEATURED STOCK ARTICLE : Near High After Third Consecutive Gain with Light Volume - 2/12/2019 |
View all notes |
Set NEW NOTE alert |
Company Profile |
SEC
News |
Chart |
Request a new note
C
A
S
I |
Symbol/Exchange
Company Name
Industry Group |
PRICE |
CHANGE
(%Change) |
Day High |
Volume
(% DAV)
(% 50 day avg vol) |
52 Wk Hi
% From Hi |
Featured
Date |
Price
Featured |
Pivot Featured |
|
Max Buy |
MEDP
-
NASDAQ
Medpace Holdings Inc
Medical-Research Eqp/Svc
|
$54.26
|
-0.73
-1.33% |
$55.16
|
595,376
65.79% of 50 DAV
50 DAV is 905,000
|
$71.66
-24.28%
|
1/30/2019
|
$64.10
|
PP = $65.19
|
|
MB = $68.45
|
Most Recent Note - 3/5/2019 8:57:43 PM
Failing to rebound after a damaging gap down on 2/26/19 following earnings news. Fundamentals remain strong. A rebound above the 50 DMA line ($60.06) is needed for its outlook to improve. It will be dropped from the Featured Stocks list tonight.
>>> FEATURED STOCK ARTICLE : Damaging Gap Down Triggered Technical Sell Signal - 2/28/2019 |
View all notes |
Set NEW NOTE alert |
Company Profile |
SEC
News |
Chart |
Request a new note
C
A
S
I |